
Grafana monitoring stack, consisting of Alloy, Loki, Prometheus, and Tempo, is a distributed modern monitoring system built in Go, intended for collecting monitoring information from backend applications running on one or more servers. It is also usable for monitoring mobile and desktop applications (it depends on the level of Opentelemetry support for your chosen language if we go with otlp at least. For example for Java opentelemetry reports a Stable level for both Traces, Metrics, and Logs, and thus full support is available for Android Java apps), and to some degree usable for web frontend client-side monitoring too.
Note
The series of articles is written with the assumption we will be using Opentelemetry protocol as the main one for tracing related activities at least (but also abusing for metrics and logs too if necessary), but do know that Grafana Alloy tracing/logging/metrics collecting agent supports plenty of alternative protocols and your language support in them could be with some chance better than in opentelemetry.
We will overview configuring this monitoring stack in a Docker-based approach for your homelab and for companies with a simplistic approach to infrastructure. The article aims to make the monitoring system more accessible for a large amount of people (their homelabs and basic production setups) and for this reason, we go with the Docker approach instead of the Kubernetes one. If you run serious production with high load, it is better to run Grafana/Loki/Mimir(instead of Prometheus)/Tempo in Kubernetes instead, since its ecosystem with helm charts already made it easy to run it in a horizontal scalable way and able to take much larger workload. The article will dive into configuring the monitoring with Docker-Compose and Opentofu(Terraform). When in doubt regarding smth, check Terraform-related code in infra repo for the source of truth as it is the version i run for my homelab.
It is worth to configure this monitoring distributed stack even you have only one backend application running at your servers (or even if u have only mobile app). Well configured monitoring will grant you ability to debug your application information significantly easier. Well configured logging monitoring backend wil give you ability to filter data by any key/value in the logging records. It is possible even build graphical dashboards based on Logging Information alone for overview of important information!
Note
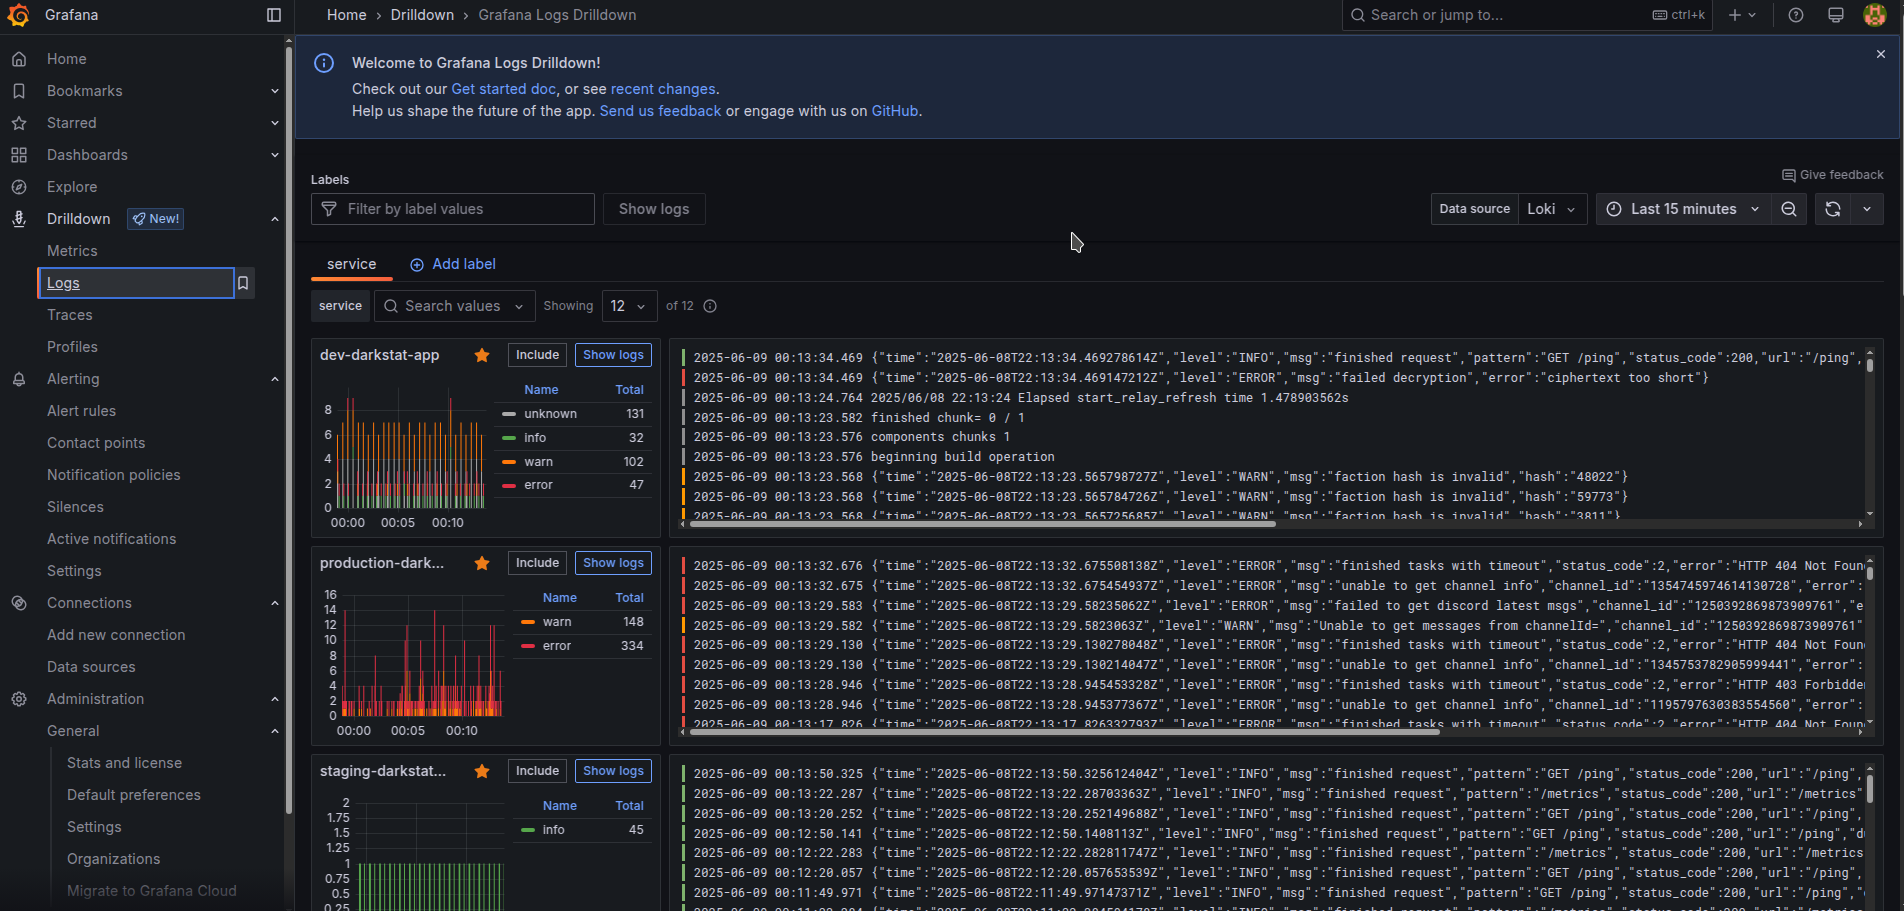
Grafana Loki became significantly more pleasant with the introduction in the 2024 year of a new Drilldown interface that simplifies navigation considerably. The old “Explore” interfaces still have some usage cases left that new Drilldown interfaces do not cover yet, but the gap is quickly closing and for Logging part I believe there is no big justification to open old “Explore” interface any longer.
Tip
I recommend you invest properly into other forms of monitoring like Metrics, as they help overview the healthy functioning of your application in high high-performing way and bring you simplification in investigating problems raised from your next deployments. Metrics way of monitoring has plenty of open source solutions that bring them running out of the box for any type of infrastructure object. It is also a good idea depending on your application needs to invest in Tracing for more deep transparency regarding its performance problems. Configurations beyond Loki will be overviewed in separate next-part articles to keep the size of the current article to a reasonable time of comprehension.
Tip
We can build graphical dashboards based on logs alone! It is not efficient in comparison to using metrics, yes it is possible and necessary thing to be used as a last resort, or good enough to use in low-load systems.
You need to get somewhere Linux server for deployment (it can be baremetal your own server, or it can VPN rented from some cloud provider). I could recommend Hetzner server, due to the provider being very minimalistic and of a high quality with having quite low prices. Its Arm64 prices for servers are looking to me like a killing feature.
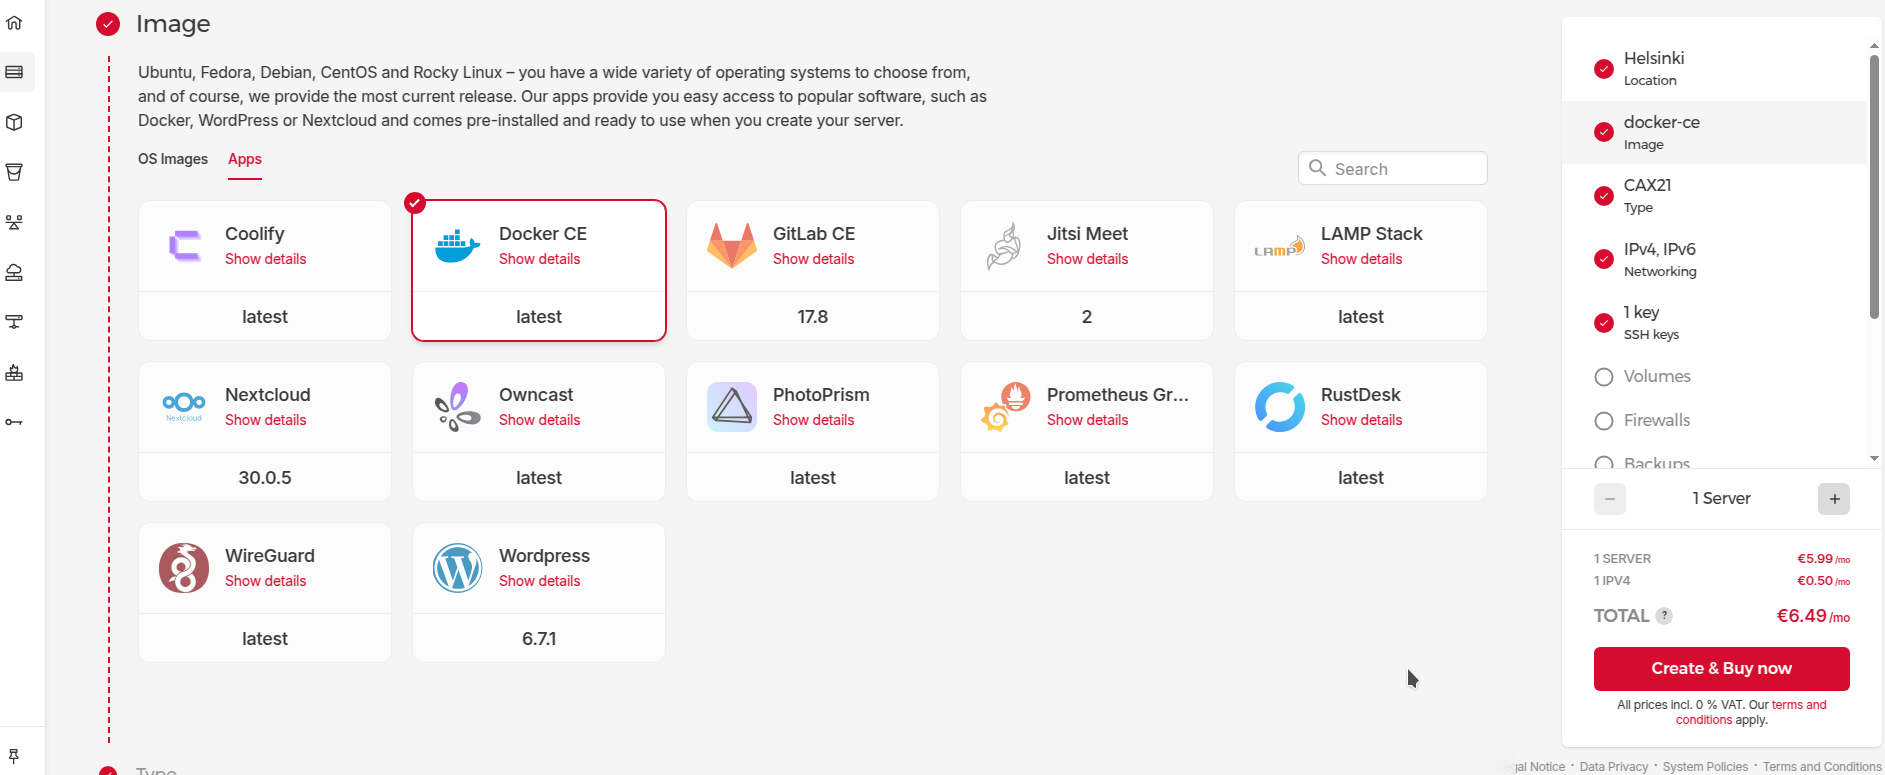
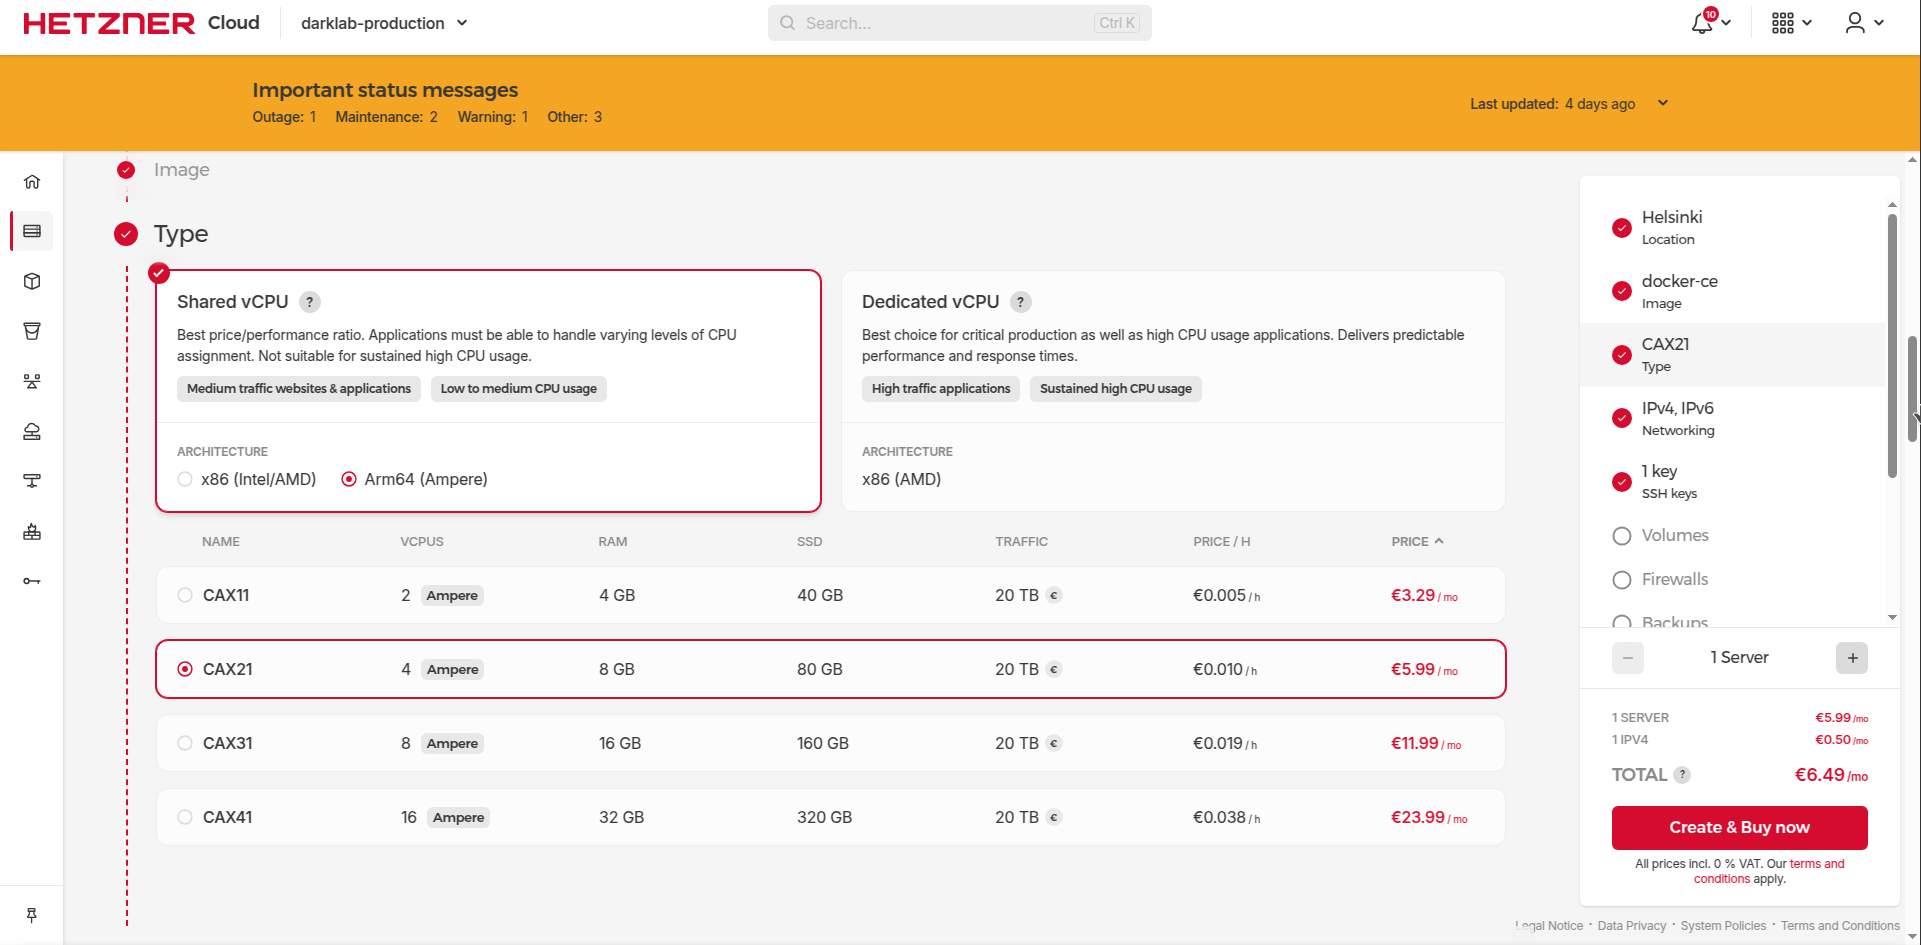
CAX21 server should be more than enough overkill for our purposes for homelab example purposes. You can squeeze things even into CAX11 if desired, but be mindful preferably to turn on Swap just in case as a fallback for insurance to handle the workload for everything put in at the start.
Opentofu(Terraform) code is provided to configure things infrastructure as a code. See this link for up-to-date code in case the article became outdated.
module "node_darklab_cax21" {
  source     = "../modules/hetzner_server"
  name       = "darklab"
  hardware   = "cax21"
  backups    = true
  ssh_key_id = module.ssh_key.id
  datacenter = "hel1-dc2"
}
Which utilizes code from this folder https://github.com/darklab8/infra/tree/master/tf/modules/hetzner_server
Caution
I highly encourage you to attach Hetzner’s firewall to the server as it is configured according to this code . And allow only traffic for 80 and 443 udp and tcp (for our caddy web reverse server), 22(tcp for ssh), and icmp for ping ports.
The configured cloud-level firewall ensures that in case you forget something about docker security, you have a nice fallback protecting your containers. That is important with docker, which by default binds applications to 0.0.0.0 when using -p 8000:8000 exposure and it bypasses host-level firewalls like ufw. Cloud-level firewall is your last safe net here in case of human error and misconfigurations.
If u configure the server manually, please create ssh key with ssh-keygen command (Usually available right away in Linux as long as git is installed at least), u can make it available on Windows too if you open Git bash console that becomes available with installation of git
Assuming u created everything correctly, u can make a record in your ~/.ssh/config
Host homelab
  HostName 65.109.15.108 # replace with IP address shown in hetzner interface
  User root
  IdentityFile ~/.ssh/id_rsa.darklab # replace with name of your SSH key
  IdentitiesOnly yes
and connect to it by using ssh homelab command. Once u connect and verify yes, u will see server insides and be ready for next steps
$ ssh homelab
The authenticity of host '65.109.15.108 (65.109.15.108)' can't be established.
ED25519 key fingerprint is SHA256:mQ5+B+9e/1xn3GmRvd0pBnINxtjiLazwT8CMNvI7YcU.
This key is not known by any other names
Are you sure you want to continue connecting (yes/no/[fingerprint])? yes
Warning: Permanently added '65.109.15.108' (ED25519) to the list of known hosts.
Welcome to Ubuntu 24.04.1 LTS (GNU/Linux 6.8.0-52-generic aarch64)

# bla bla bla, other long text

root@homelab-example:~#
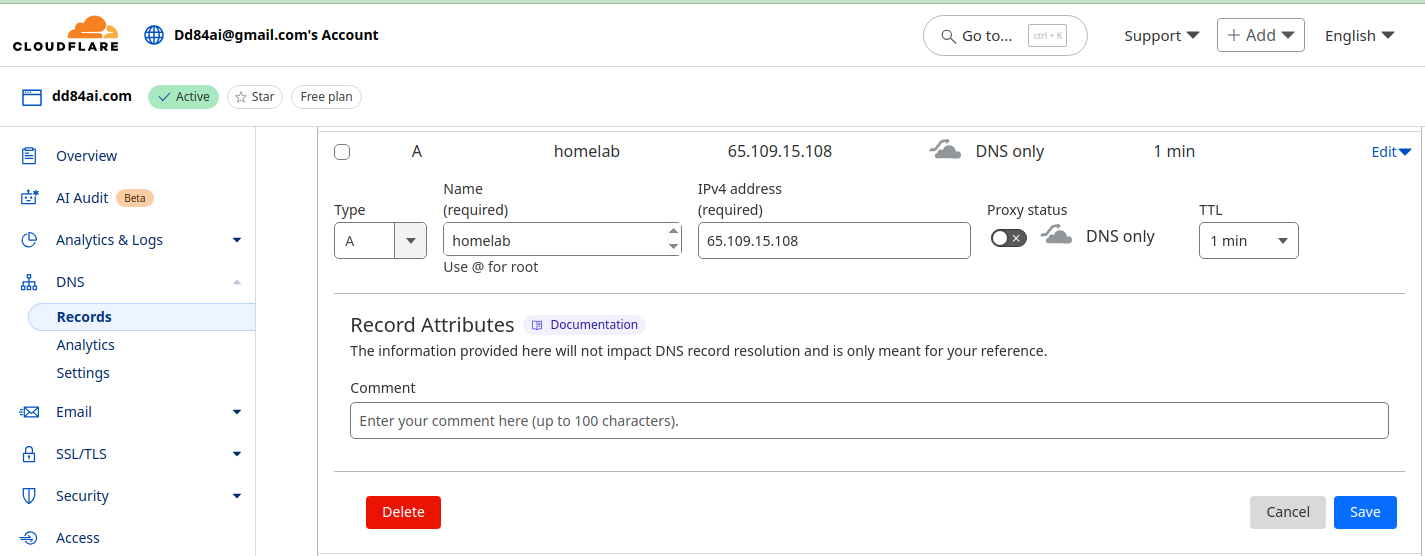
Buy some domain for your server, so that we can have a nice address like https://homelab.dd84ai.com for the opening of the website later with TLS encryption in a named way. We Optionally use free DNS from deSec
Create A record leading to the public IP of the server.
Once we get the server, we can proceed to the next step of configuring our monitoring stack. We assume it will be served by Caddy for lets encrypt and reverse proxy.
Note
We assume you have installed Docker Engine and work from Linux. Instructions may work for WSL2 with Docker Engine or Docker Desktop too, but not guaranteed. With Docker available locally you will be able to apply instructions from this tutorial without being at the server directly. Instructions for Docker Engine installations can be found here: https://docs.docker.com/engine/install/ubuntu .
If you used a Docker app image from Hetzner, then Docker is already installed on the server. As a last resort, u can just execute the tutorial instructions directly on the server, just skip DOCKER_HOST instruction that will be mentioned next
We configure with Docker-compose
Note
For the convenience of working with some of the services running as docker swarm services for easy rotation of their image from CI, we utilize some swarm docker network (overlay) which requires running “docker swarm init” at your server.
Tip
you can check Opentofu(Terraform) configuration in addition at the next address
Important
we provide docker-compose way of configuration as demo example because more devs are highly likely familiar and comfortable with docker-compose than with terraform. We utilize terraform for configuration of it and recommend it to use instead of docker-compose if u can. Book “Terraform up and running” is excellent place to start with it.
version: "3.8"

services:
  caddy:
    image: lucaslorentz/caddy-docker-proxy:2.9.1
    container_name: caddy
    restart: always
    networks:
      - caddy
    ports:
      - "80:80"
      - "443:443"
    volumes:
      - /var/run/docker.sock:/var/run/docker.sock:ro
      - caddy_data:/data
    logging:
      driver: json-file
      options:
        mode: non-blocking
        max-buffer-size: 500m
  grafana:
    build:
      dockerfile: ./Dockerfile.grafana
      context: .
    container_name: grafana
    restart: always
    environment:
      - GF_SECURITY_ADMIN_PASSWORD=${GRAFANA_PASSWORD}
      - GF_SECURITY_ADMIN_USER=admin
      - GF_FEATURE_TOGGLES_ENABLE=alertingSimplifiedRouting,alertingQueryAndExpressionsStepMode
      - GF_PLUGINS_PREINSTALL_SYNC=grafana-exploretraces-app@1.4.1@https://grafana.com/api/plugins/grafana-exploretraces-app/versions/1.1.0/download
    networks:
      - grafana
      - caddy
    volumes:
      - grafana_data:/var/lib/grafana
    logging:
      driver: json-file
      options:
        mode: non-blocking
        max-buffer-size: 500m
    labels:
      caddy_0: demo.dd84ai.com
      caddy_0.reverse_proxy: "{{upstreams 3000}}"
  loki:
    build:
      dockerfile: ./Dockerfile.loki
      context: .
    container_name: loki
    restart: always
    entrypoint: ["/usr/bin/loki"]
    command: ["-config.file=/etc/loki/local-config.yaml"]
    networks:
      grafana:
        aliases:
          - loki
    volumes:
      - loki_data:/data
    logging:
      driver: json-file
      options:
        mode: non-blocking
        max-buffer-size: 500m
    mem_limit: 1000m
  alloy-logs:
    build:
      dockerfile: ./Dockerfile.alloy.logs
      context: .
    container_name: alloy-logs
    restart: always
    networks:
      grafana:
        aliases:
          - alloy-logs
    entrypoint: ["/bin/alloy"]
    command: ["run","/etc/alloy/config.alloy","--storage.path=/var/lib/alloy/data"]
    volumes:
      - /var/run/docker.sock:/var/run/docker.sock:ro
    logging:
      driver: json-file
      options:
        mode: non-blocking
        max-buffer-size: 500m
    deploy:
      resources:
        limits:
          memory: 1000M

networks:
  grafana:
    name: grafana
    driver: overlay
    attachable: true
  caddy:
    name: caddy
    driver: overlay
    attachable: true

volumes:
  caddy_data:
    name: "caddy_data"
  grafana_data:
    name: "grafana_data"
  loki_data:
    name: "loki_data"
Participating configs:
Proceed to apply deployment for raising the monitoring stack (or use Opentofu(Terraform) to raise all stuff together as modules from ./main.tf)
git clone --recurse-submodules https://github.com/darklab8/blog
cd blog/articles/article_detailed/article_20250609_grafana/code_examples

# if docker-compose way
export DOCKER_HOST=ssh://root@homelab
docker ps
docker compose build
export GRAFANA_PASSWORD=INSERT_YOUR_DESIRED_PASSWORD_HERE # replace to your own desired choice
export GRAFANA_DOMAIN=homelab.dd84ai.com # replace to your own desired choice
docker compose up -d

# if opentofu way
tofu init
tofu apply

# after deploy, u need to grant loki proper rights to be persistent
chmod -R a+rw /var/lib/docker/volumes/loki_data
Verify everything works correctly.
root@homelab-example:/var/lib/docker# docker ps
CONTAINER ID   IMAGE                                   COMMAND                  CREATED          STATUS          PORTS                                                                                NAMES
43248d1628c7   code_examples-alloy-logs                "/bin/alloy run /etc…"   11 minutes ago   Up 11 minutes                                                                                        alloy-logs
f51525f219e7   lucaslorentz/caddy-docker-proxy:2.9.1   "/bin/caddy docker-p…"   11 minutes ago   Up 11 minutes   0.0.0.0:80->80/tcp, :::80->80/tcp, 0.0.0.0:443->443/tcp, :::443->443/tcp, 2019/tcp   caddy
6b2b8c033d6d   code_examples-loki                      "/usr/bin/loki -conf…"   11 minutes ago   Up 11 minutes   3100/tcp                                                                             loki
16ff853a1ba4   code_examples-grafana                   "/run.sh"                11 minutes ago   Up 11 minutes   3000/tcp                                                                             grafana
if smth is in status restarting or running suspiciously, check its logs
docker logs alloy-logs for example (if container has set explicit easy to use name)docker logs 43248 (inserting beginning of a container id)docker-compose logs alloy-logsIf everything works as intended, you can log into grafana with username admin and password u inserted into GRAFANA_PASSWORD env var
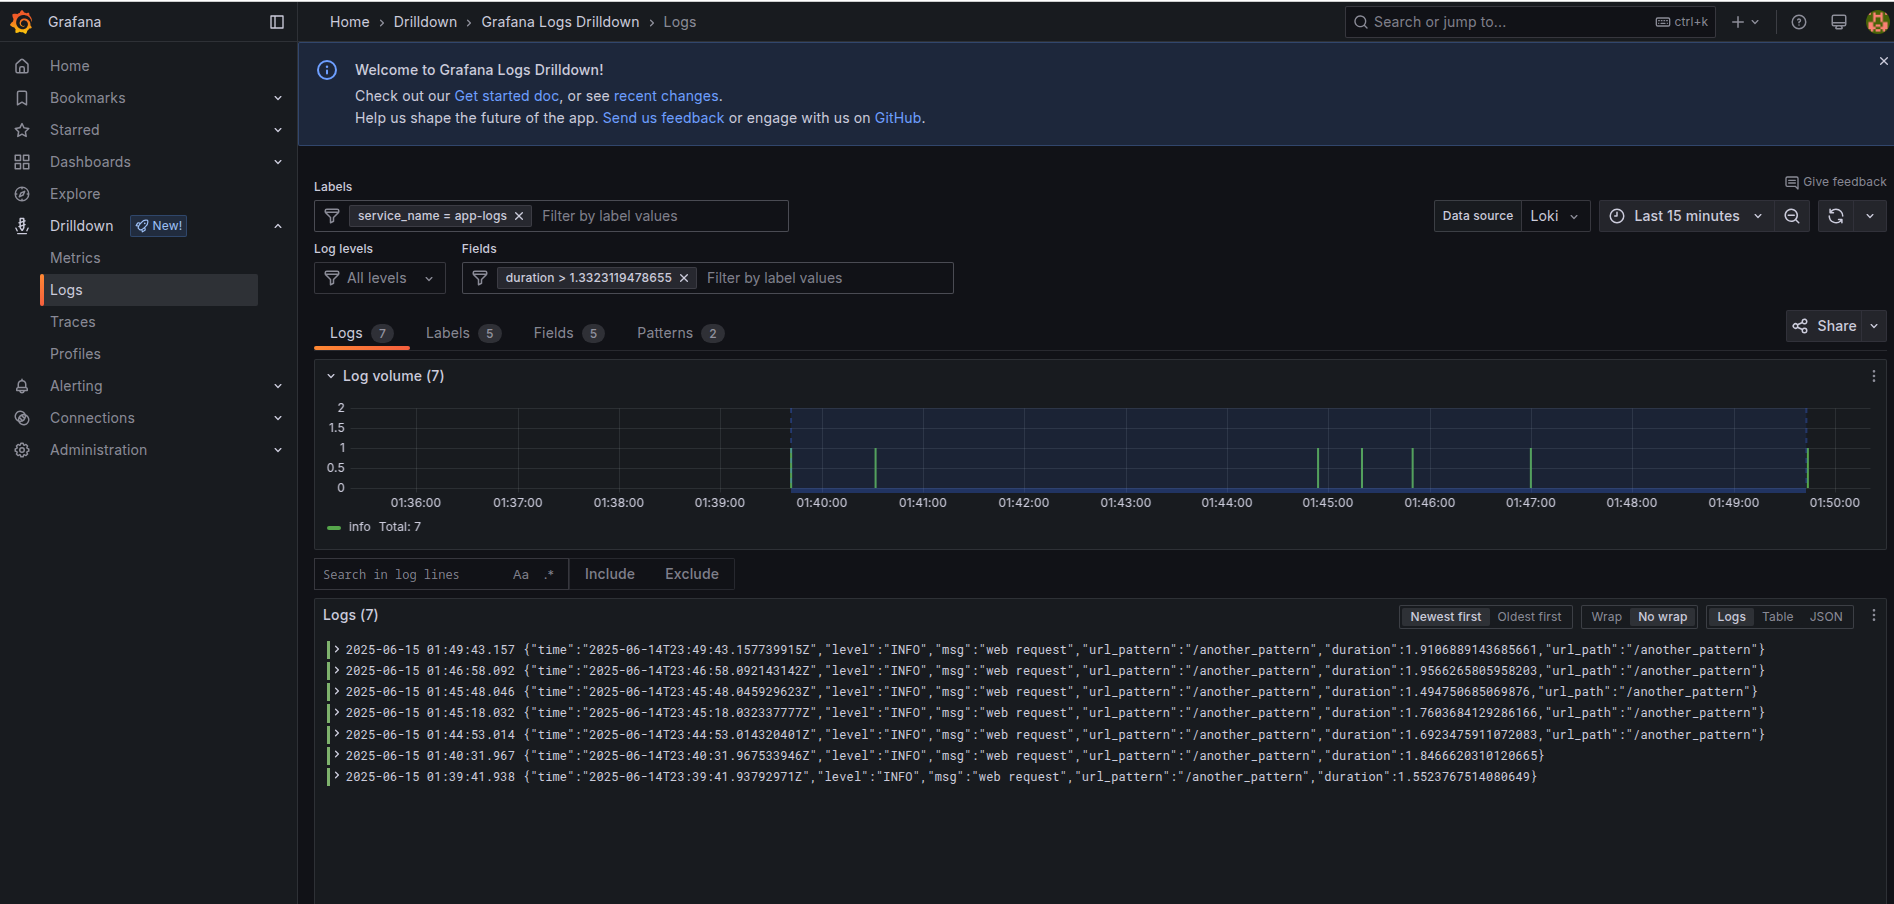
Now you can observe logs for all your running docker containers
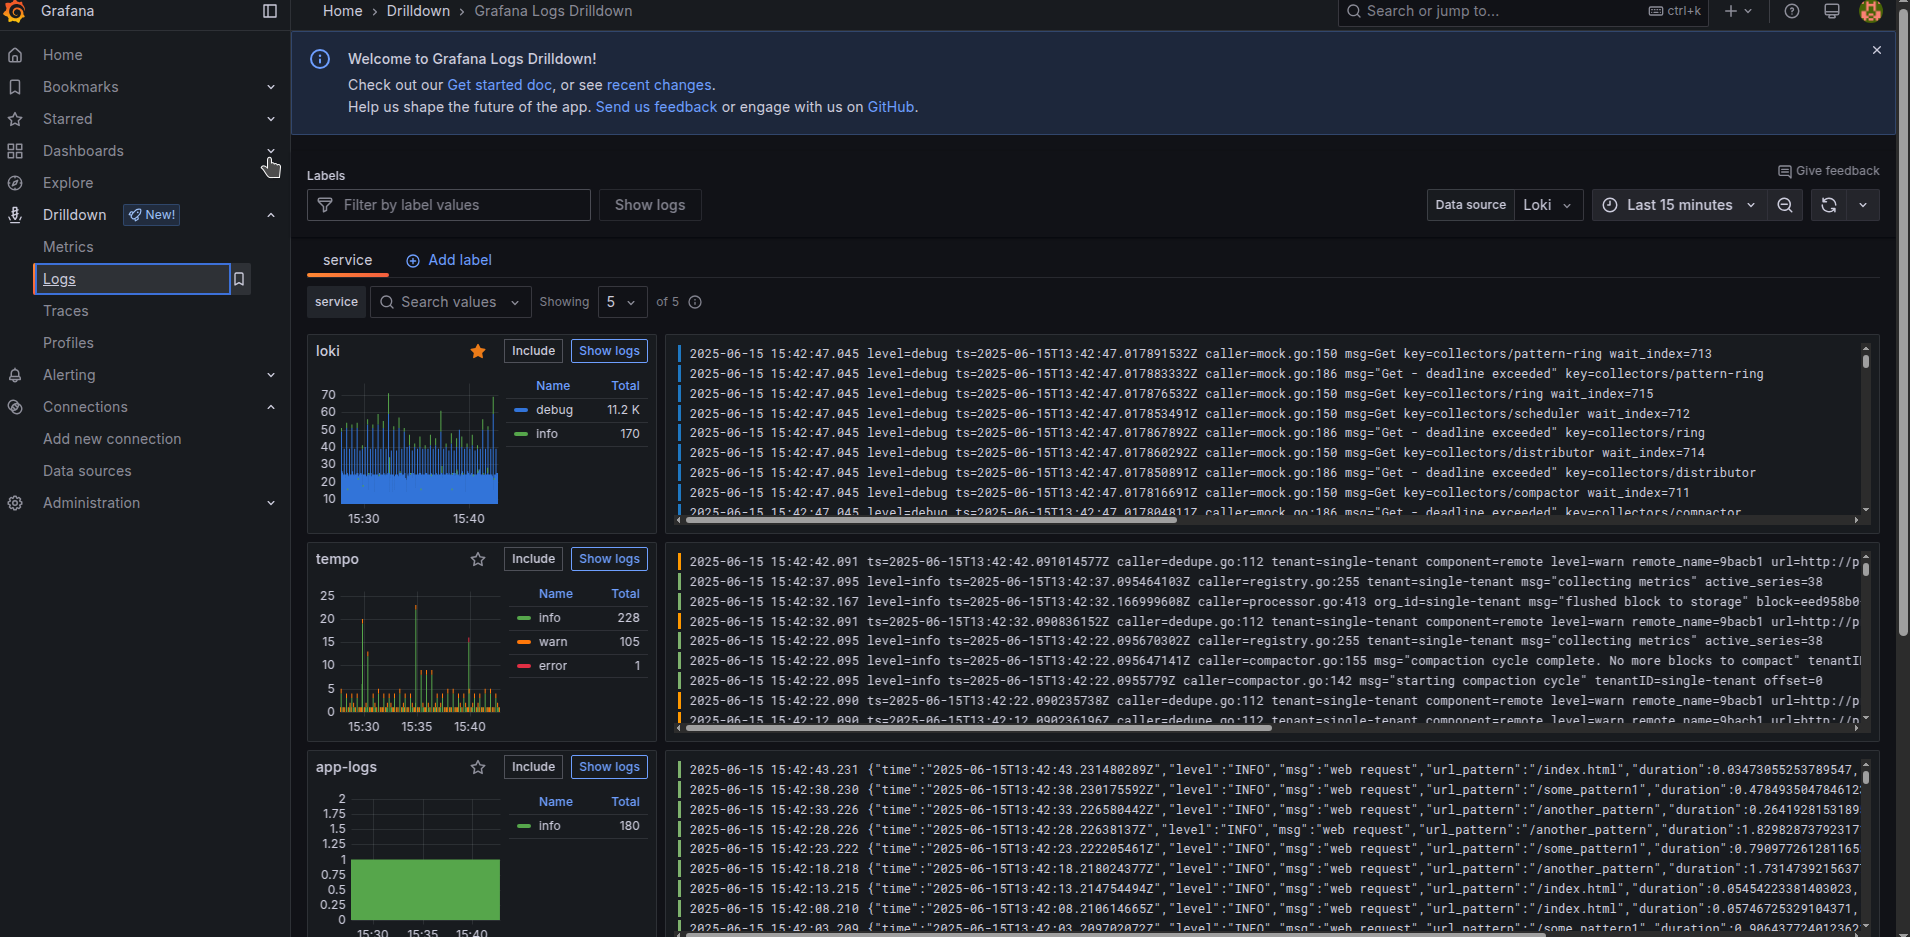
Select a desired application and navigate logs in it easily by selecting specified log levels
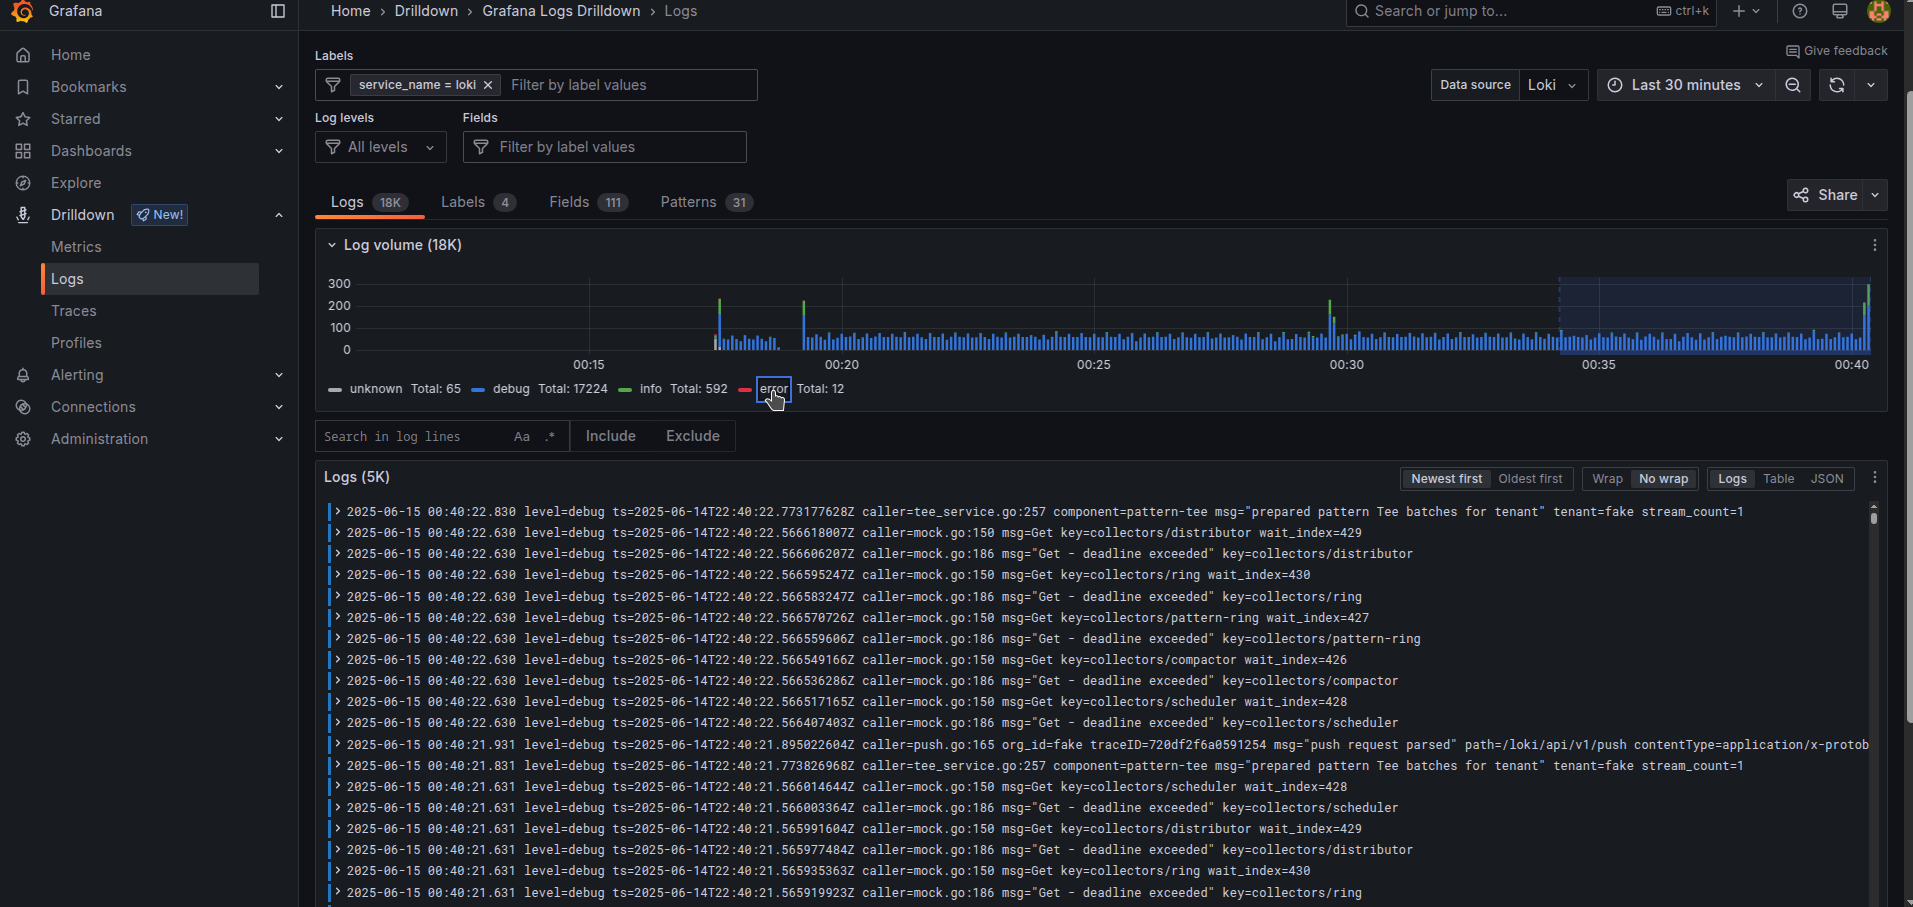
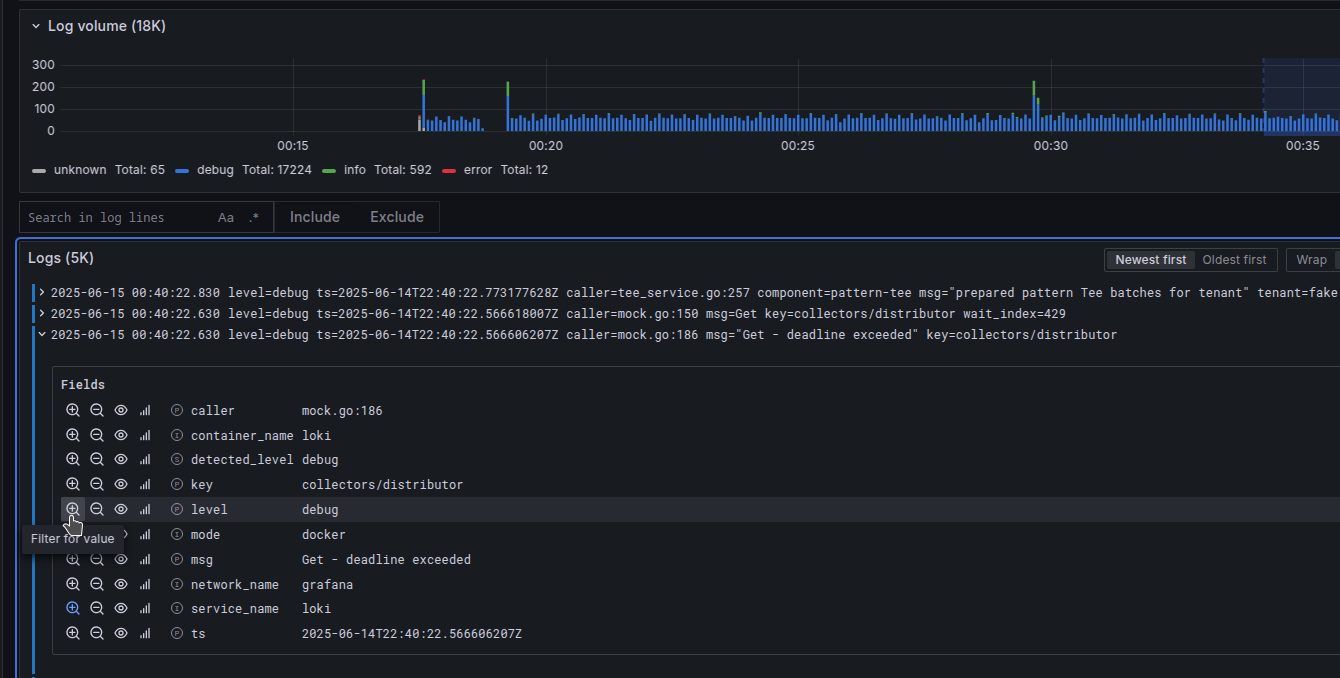
Or by checking filtering quickly to select options. The same is doable at the top of a panel in the Labels bar, and Log levels bar. Filtering by any text simply can be done with the menu “Search in log lines” and pressing “Include” to specify some search.
Important
Make sure to emit your logs in JSON format! The logging drilldown interface will automatically recognize all your JSON key values as legit labels in a simple way. In Explore and LogQL queries u will need to specify JSON format separately for that to work though.
A bit below we deploy simple application examples which we will use for more advanced examples. After u deploy it, try to filter logs by minimal duration, switching between different applications, filtering to specific url pattern
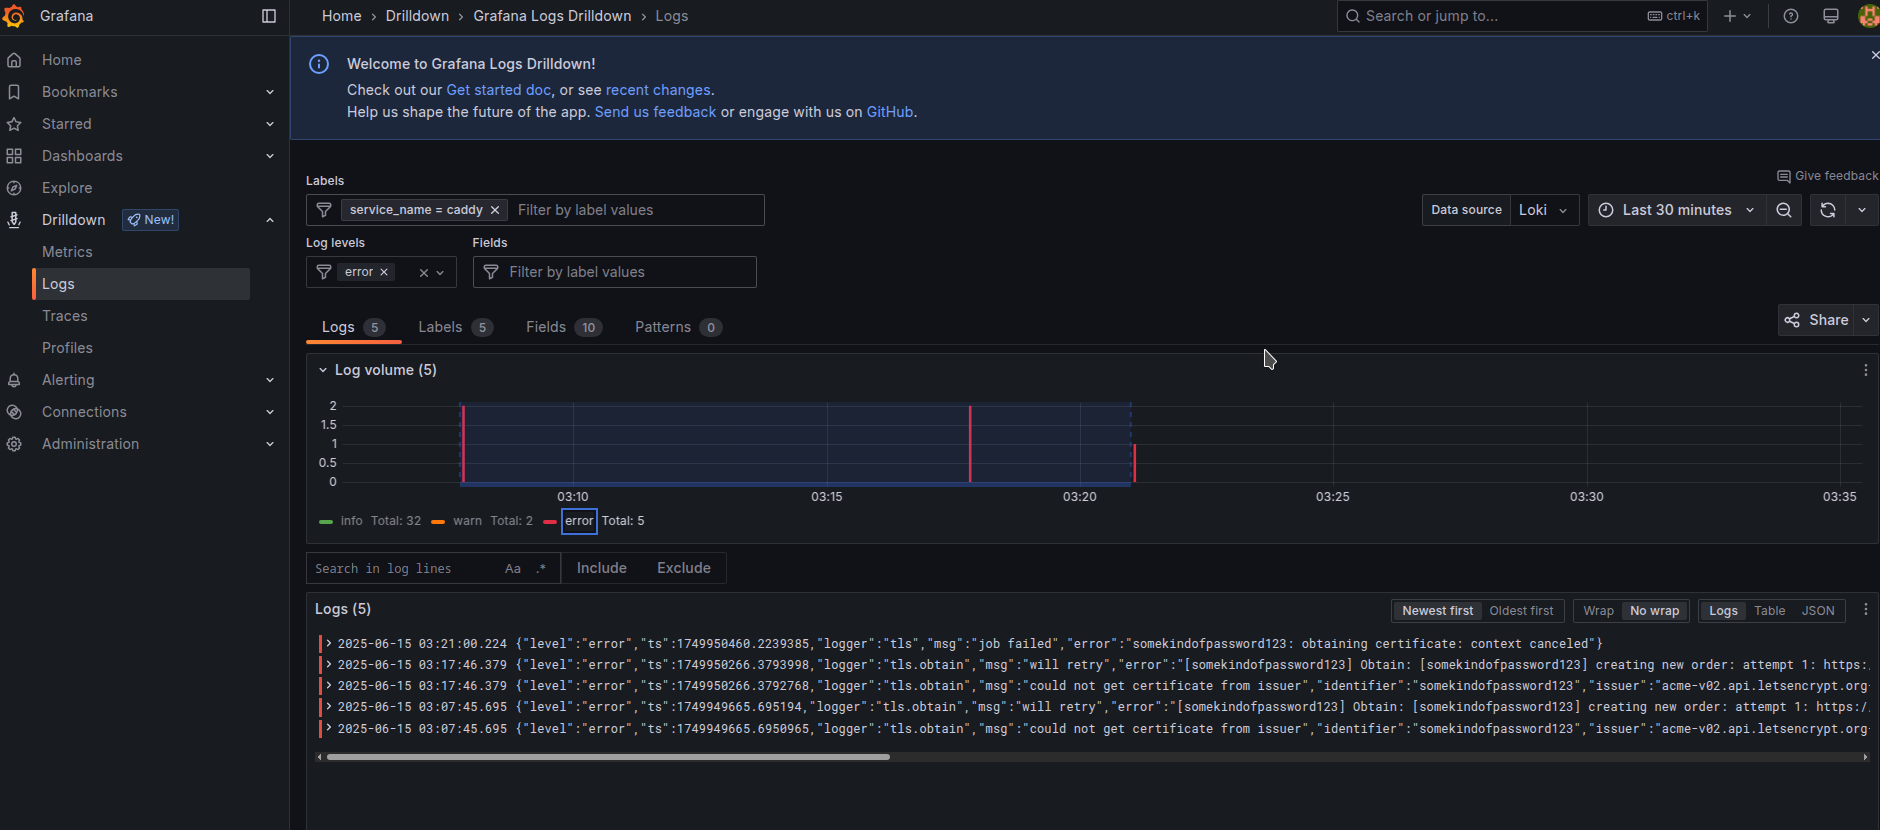
We had a bit of errors in the caddy, which we can filter to error level of logs only.
Dashboards using Loki are not very good in performance feature and it has problems working fast enough for horizontally scaled applications having too many logs, it is more last resort thing to grab essential analytics, and it is good to use the feature when u need to use values and their precisions that could just not fit metrics. You should configure Mimir/Prometheus with Metrics and compressions through Recording rules for high-load applications. For low-workload applications with only single instance of running it is more than enough in performance feature.
To give an example of web-like app emitting logs, we created a dummy app example.
export DOCKER_HOST=ssh://root@homelab
docker compose -f docker-compose.app-logs.yaml build
docker compose -f docker-compose.app-logs.yaml up -d
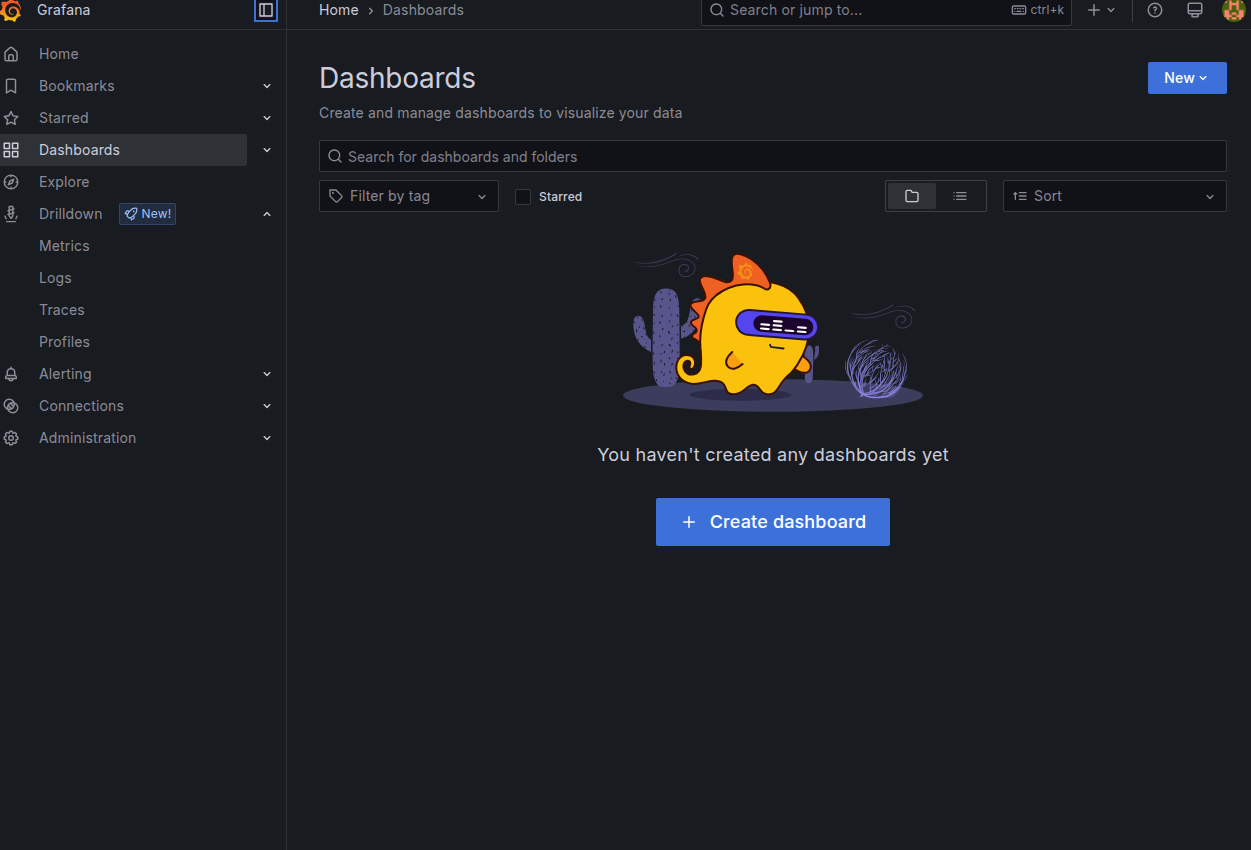
now let’s create some dashboard using Loki data alone using Loki as a data source in a flexible “code” mode
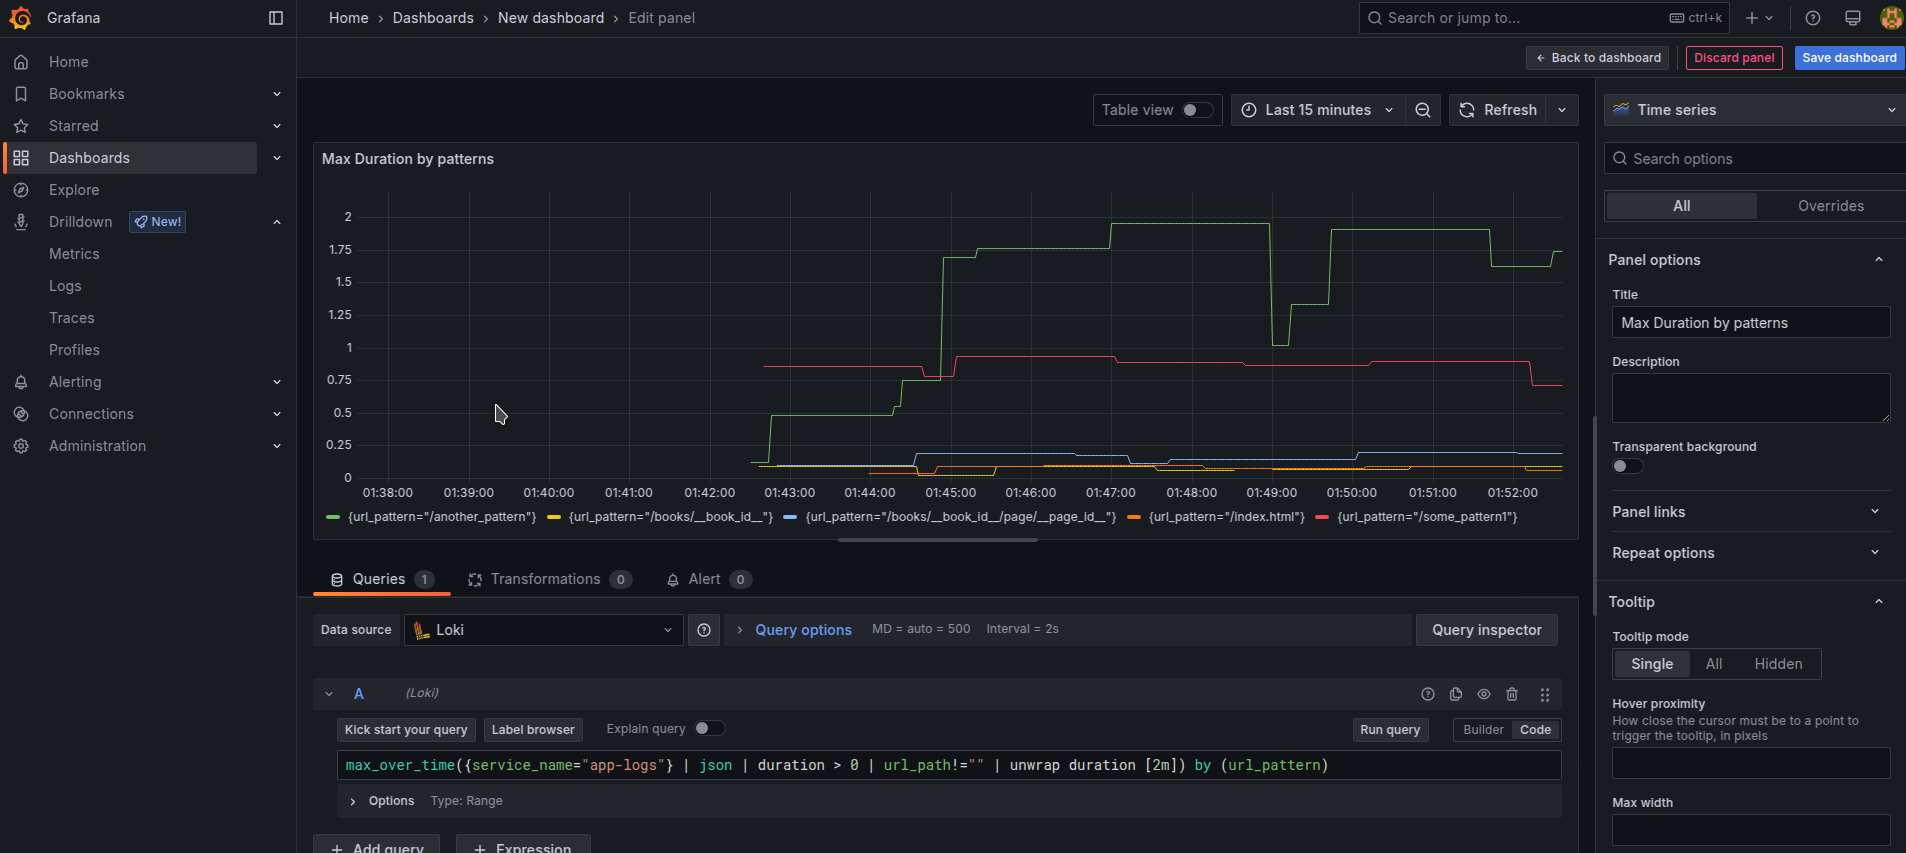
Using a new LogQL query with picking possible functions from Metric Queries page about Loki we receive our first dashboard of Max Duration by url pattern over 2m. Notice how we used unwrap function to select specific numeric values to be used in formulas, that is an important part of enabling such things
max_over_time({service_name="app-logs"} | json | duration > 0 | url_path!="" | unwrap duration [2m]) by (url_pattern)
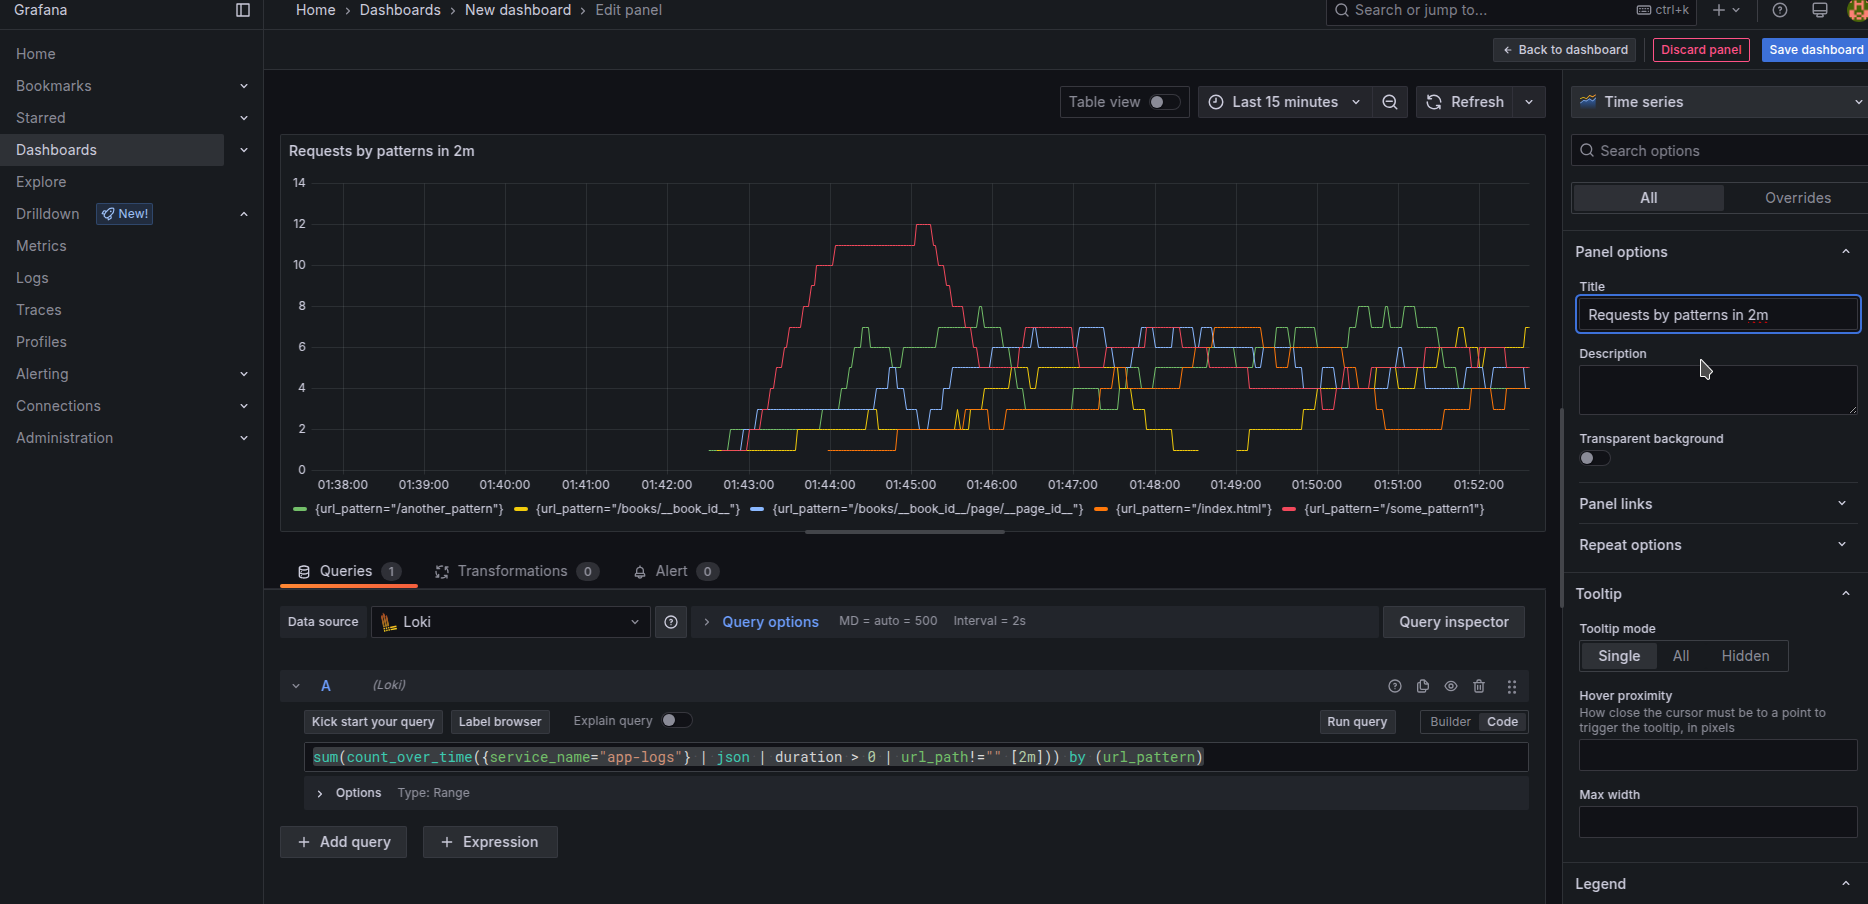
Alternatively, we could see the number of requests by url pattern in general over 2m
sum(count_over_time({service_name="app-logs"} | json | duration > 0 | url_path!="" [2m])) by (url_pattern)
 if you output other information like user IPs, user agents, requests incoming body size, or response body size
you could build the diagrams by grouping them with other parameters or by showing which URL endpoints use a large amount of input or output internet traffic.
if you output other information like user IPs, user agents, requests incoming body size, or response body size
you could build the diagrams by grouping them with other parameters or by showing which URL endpoints use a large amount of input or output internet traffic.
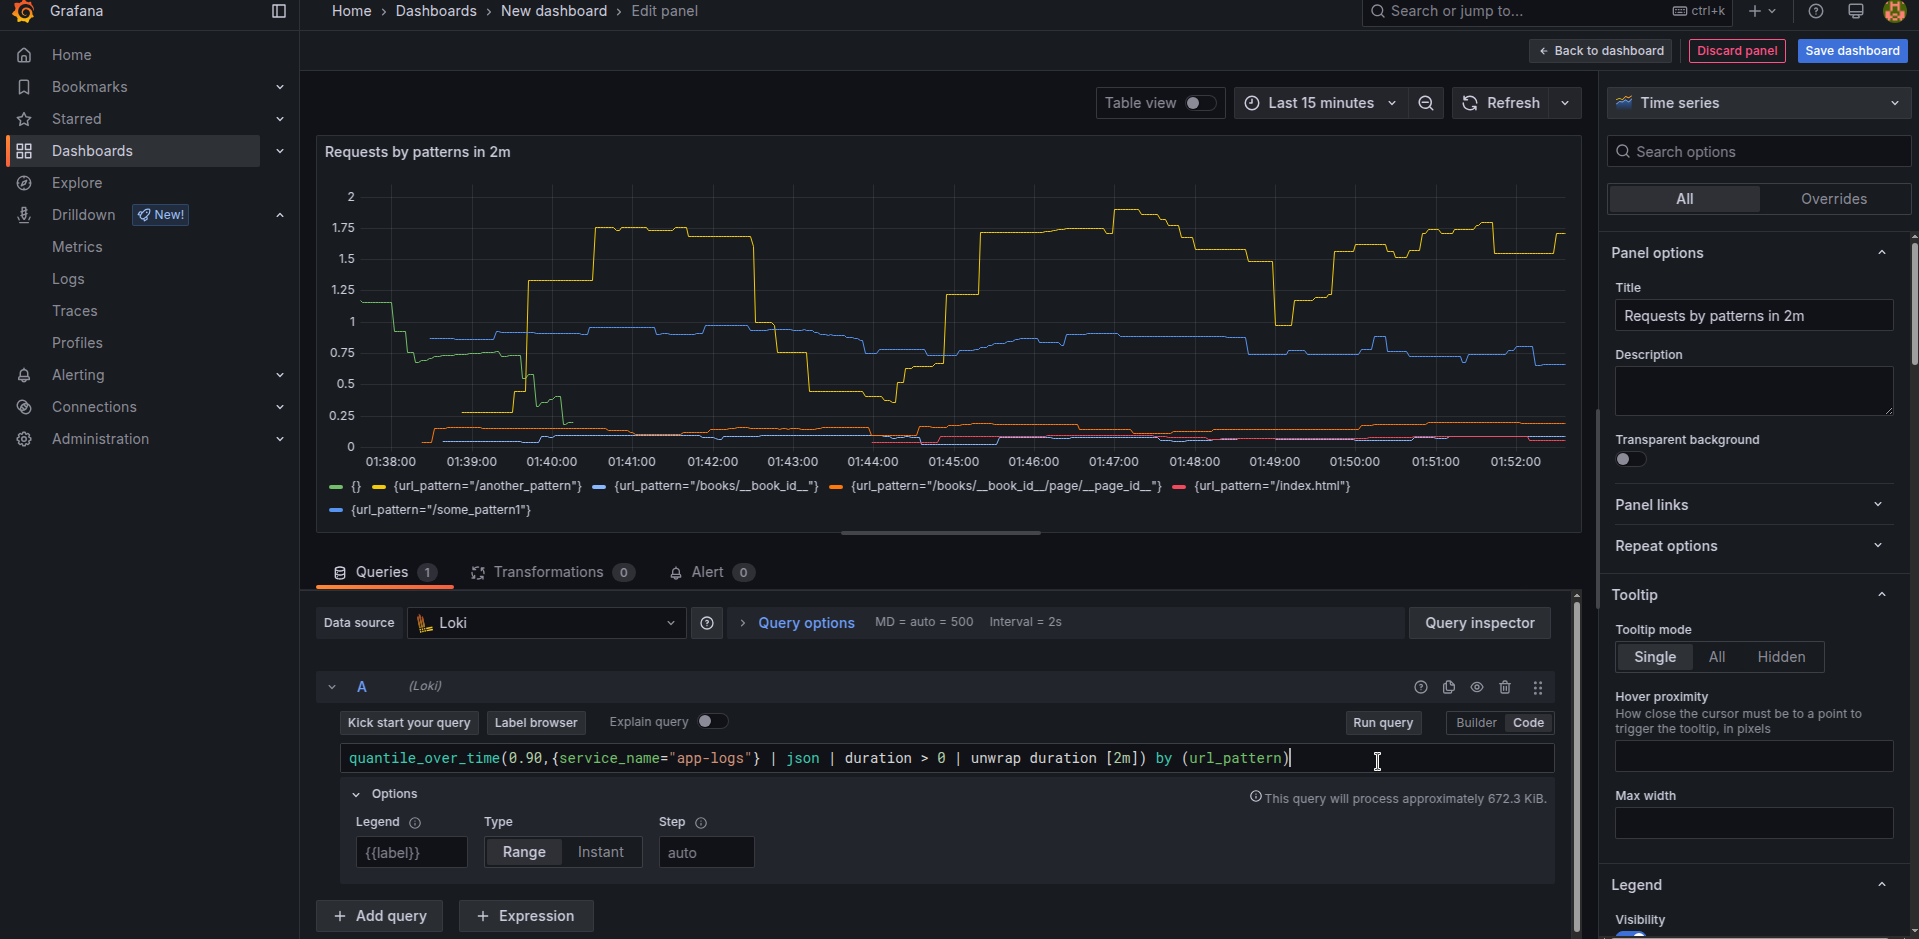
In case u need to see 10% worst requests based on metrics like duration (or using body size or whatever else u have), u can use quantile-based formulas.
quantile_over_time(0.90,{service_name="app-logs"} | json | duration > 0 | unwrap duration [10m]) by (url_pattern)
 Similarly if u need just average results, utilize
 avg_over_time without a quantile number instead.
Saving it all together, setting Title names, changing units to Seconds for duration-based diagrams, optionally changing some of them to look like Bar chart, and having a legend in Table mods with showing Last/Mean values we receive a final-looking application debugging dashboard looking like this.
Such a look is way easier to navigate than Raw logs, isn’t it? :]
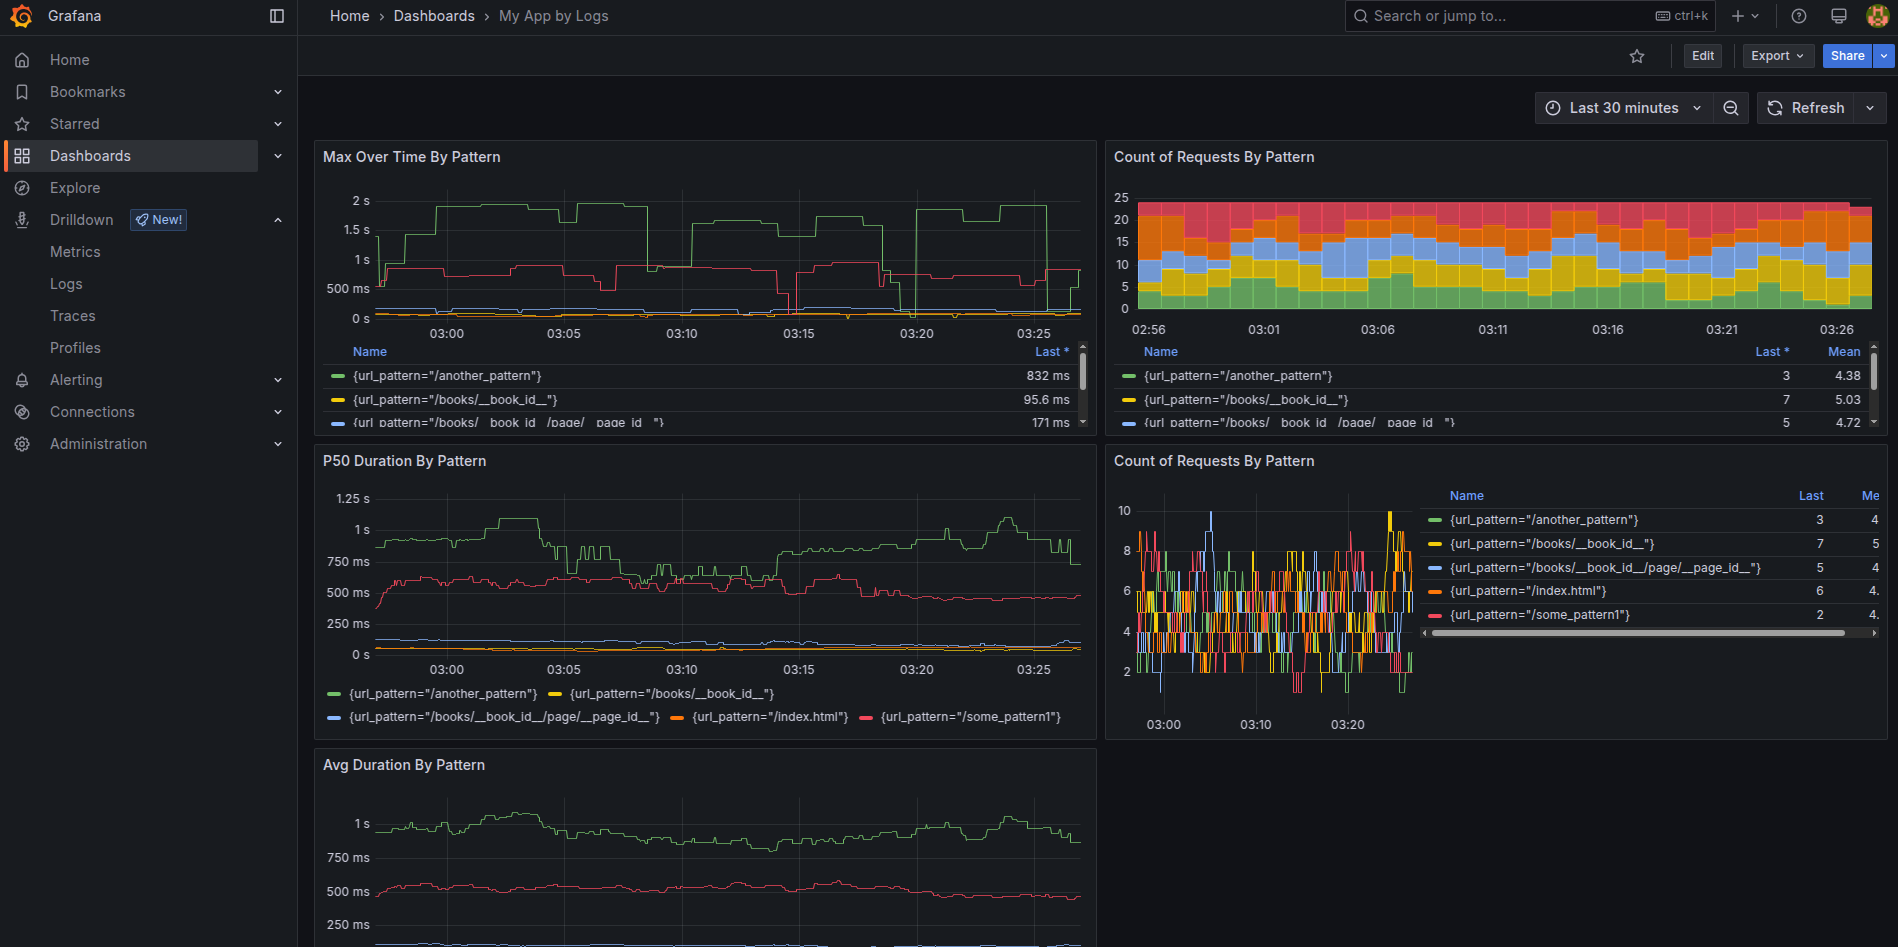 The final looking dashboard is provided for optional import as JSON code
That’s it for the first part of setting up Grafana + Loki + Alloy. We will have the next article parts, concentrated on Metrics, Traces, and Alerts. Try to use the Logging drilldown interface and filter in different ways logs, and navigate to different services with it.
Up-to-date versions of articles with possible fixes and next parts will be possible to find here. Check the next part, configuring Tracing with Tempo.
Update for 2026 year: Victoria logs connected to Grafana can do the same with 5 times less RAM usage and has 5 times less Disk usage. And at the same time faster query performant in terms of metrics for logging volumes. in around the first part of 2026 year Victoria Logs integration with grafana received powerful update making GUI interface very easy to use and feature rich. For serious production in horizontal scaled infrastructure best to pick Victoria logs today. It has Loki push endpoints to serve as drop in replacement for intake purposes.