
Monitoring with metrics is the most useful because they tell you roughly when and where the issue is.
Metrics show detalization When, and What. historic data that gives us understanding where is the source of the issue or the timeframe where to dig for data (by logs and traces) further.
You no longer need real-time watching current values of application usage, you are able to monitor historic data and finding clues among the noticed patterns!
The most important quality of Metrics is that they are HIGHLY PERFORMANT to query and to store. They are taken one time per 1 minute for example, per 1 unit set of labels (application_name, endpoint_name, status_code as example of labels). So when Logging monitoring, we can be struggling to have weeks of data retention, and tracing is barely affordable to see days of data, we are still able to see Metrics data for many months even in the most high loaded infrastructure.
The biggest and most often mistake people make is having a lot of unique labeled values in some metric. that causes rapid RAM usage explosion and storage as well. You can debug which metric consumes a lot of space by using query
topk(20, count by (__name__, job)({__name__=~".+"}))
optionally, if you know a specific label in a metric has a lot of values but you have trouble to identify which ones, you can be outputing metric label values grouped by first N characters. Here is the example we output span_name in traces_spanmetrics_latency_count, grouped by the first 5 characters.
sum by (span_prefix) (
  label_replace(
    traces_spanmetrics_latency_count,
    "span_prefix",
    "$1",
    "span_name",
    "(.{5}).*"
  )
)
Important
we provide docker-compose way of configuration as a demo example because more devs are highly likely familiar and comfortable with docker-compose than with terraform. We utilize terraform for configuration of it and recommend it to use instead of docker-compose if u can. Book “Terraform up and running” is an excellent place to start with it.
services:
  prometheus:
    build:
      dockerfile: ./Dockerfile.prometheus
      context: .
    container_name: prometheus
    restart: always
    entrypoint: ["/bin/prometheus"]
    command:
      - --config.file=/etc/prometheus/prometheus.yml
      - --web.enable-remote-write-receiver
      - --enable-feature=exemplar-storage
      - --storage.tsdb.retention.time=30d
      - --storage.tsdb.retention.size=10GB
    networks:
      grafana:
        aliases:
          - prometheus
    volumes:
      - prometheus_data:/prometheus
    ports:
      - "9090:9090"
    mem_limit: 1000m

  alloy-metrics:
    build:
      dockerfile: ./Dockerfile.alloy.metrics
      context: .
    container_name: alloy-metrics
    restart: always
    privileged: true
    entrypoint: ["/bin/alloy"]
    command:
      - run
      - /etc/alloy/config.alloy
      - --storage.path=/var/lib/alloy/data
    logging:
      driver: "json-file"
      options:
        mode: "non-blocking"
        max-buffer-size: "500m"
    networks:
      grafana:
        aliases:
          - alloy-metrics
    volumes:
      - /var/run/docker.sock:/var/run/docker.sock:ro
      - /cgroup:/cgroup:ro
      - /:/rootfs:ro
      - /proc:/host/proc:ro
      - /sys:/sys:ro
      - /var/run:/var/run:rw
      - /dev/disk:/dev/disk:ro
      - /etc:/host/etc:ro
    mem_limit: 1000m

networks:
  grafana:
    external: true

volumes:
  prometheus_data:
    name: prometheus_data
Participating configs:
Proceed to apply deployment for raising the metrics stack part (or use Opentofu(Terraform) to raise all stuff together as modules from ./main.tf)
git clone --recurse-submodules https://github.com/darklab8/blog
cd blog/articles/article_detailed/article_20250609_grafana/code_examples

export DOCKER_HOST=ssh://root@demo
docker ps

# ONLY if you did not do things from previous article part about Loki or Tempo follow docker-compose path:
docker compose up -d caddy # we need it for reverse proxy and automated TLS certs
docker compose up -d grafana # visualizer where we query traces. Already yaml of provisioned datasources configured

# Continue with Prometheus article content:
# if docker-compose way:
docker compose -f docker-compose.prometheus.yaml build
docker compose -f docker-compose.prometheus.yaml up -d prometheus
docker compose -f docker-compose.prometheus.yaml up -d alloy-metrics

# if opentofu way
tofu init
tofu apply

# after deploy, u need just in case to grant prometheus proper rights to be persistent and possible to init
chmod -R a+rw /var/lib/docker/volumes/prometheus_data
chmod -R a+rw /var/lib/docker/volumes/grafana_data # just in case grant grafana rights too if not granted
If everything was configured correctly, you will be able to open Metrics Drilldown page and see incoming metrics already. This article brings alloy configuration with prewritten docker monitoring, as it is the most comfortable minimalistic approach for deployment in a homelab.
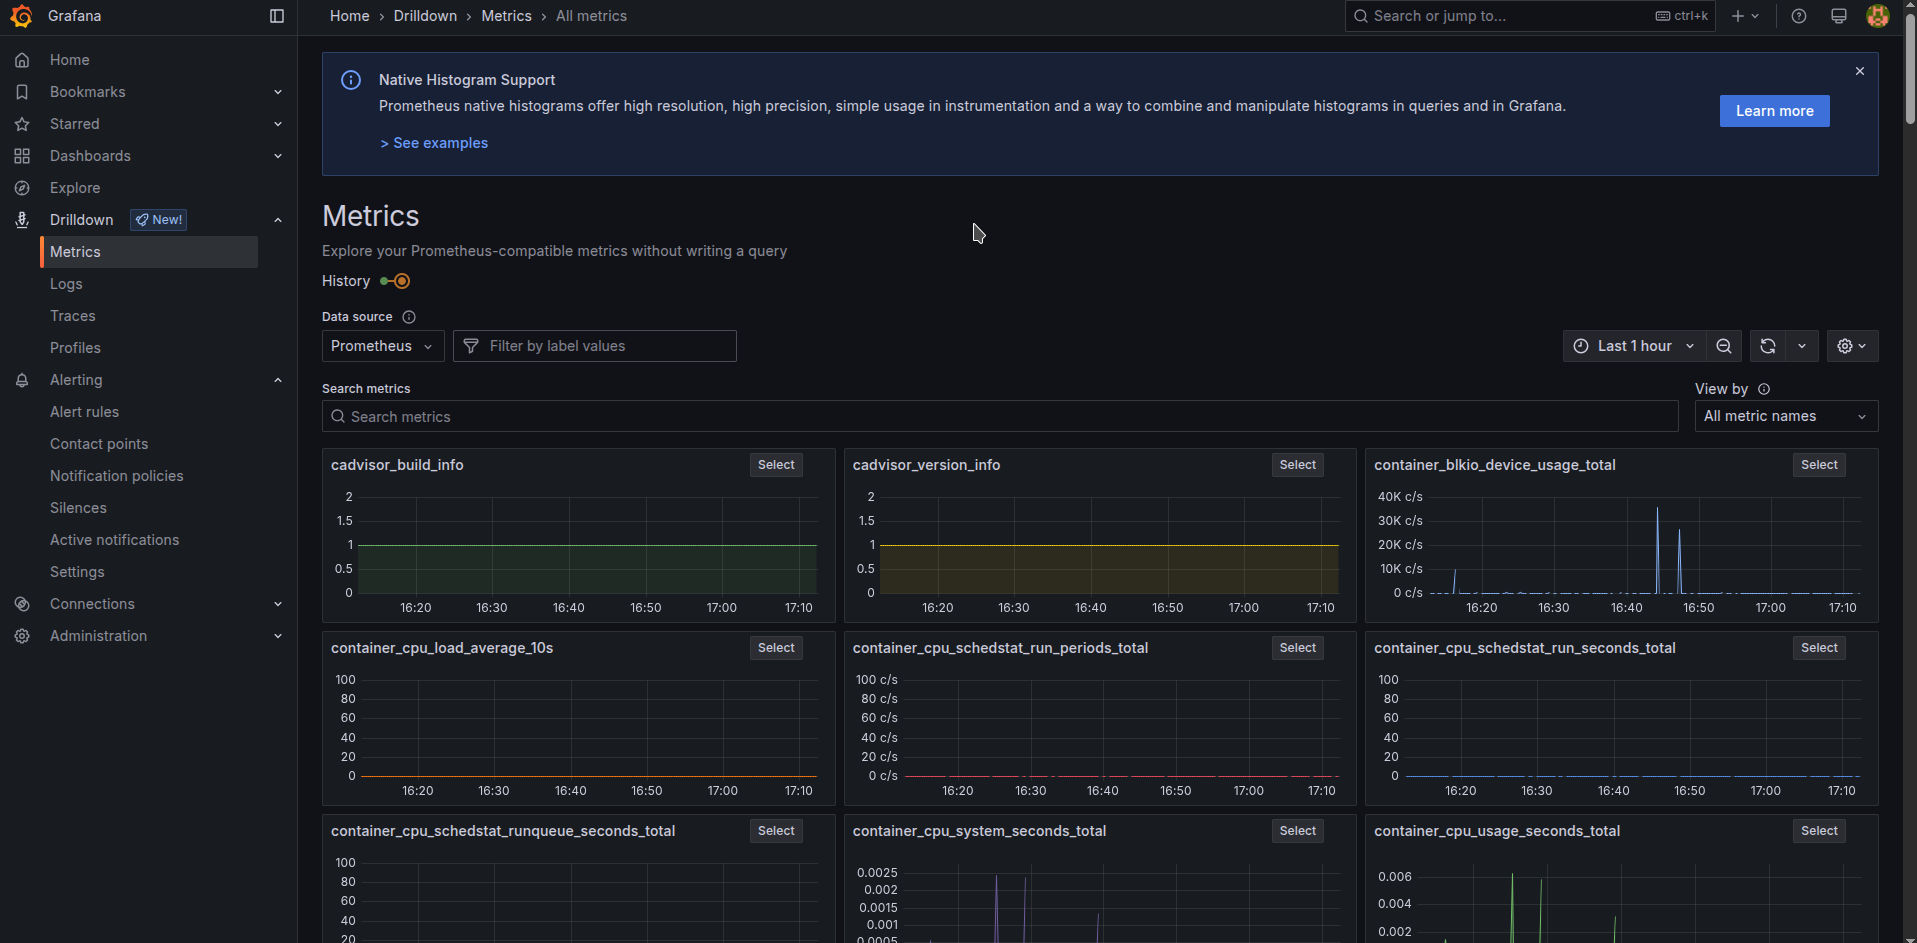
Note
If you wish monitoring by metrics something else besides docker and applications in docker, for example postgres, elasticsearch, aws cloudwatch and etc. Check grafana alloy components for other provided prometheus integrations
We raised in previous section prometheus and universal metrics metrics scrapper “alloy”, which is already configured to scrap unix, docker and app metrics.
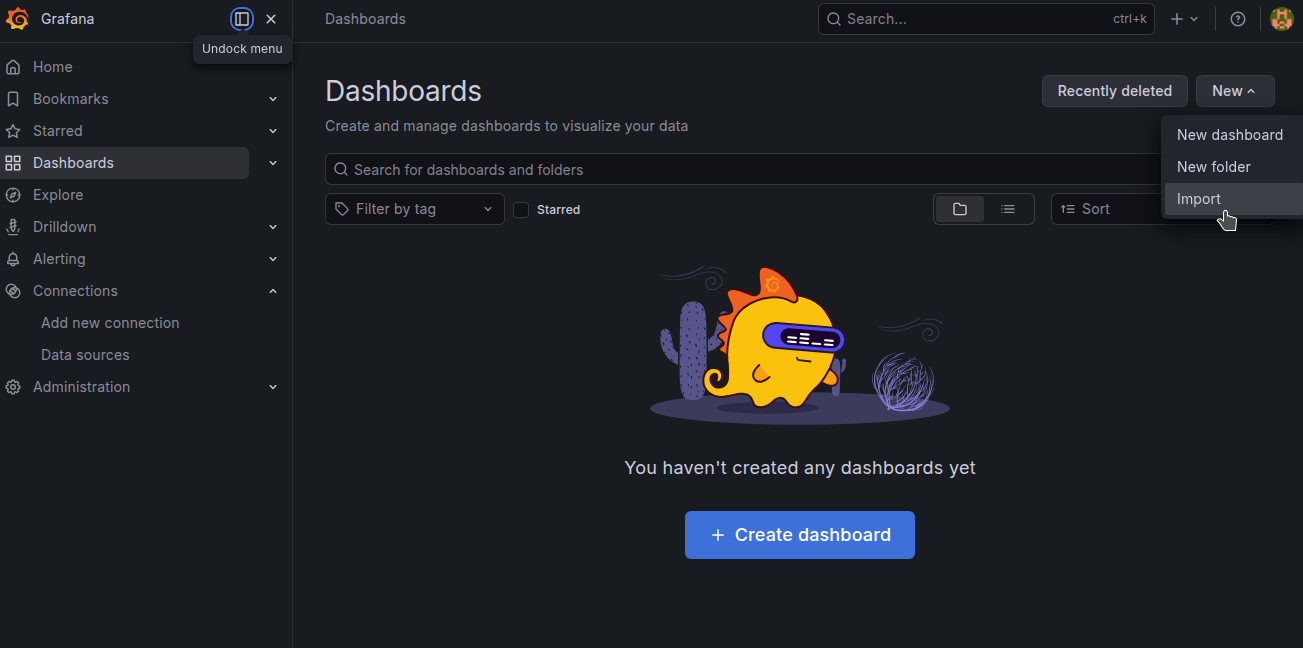
Import dashboards for Docker and Unix
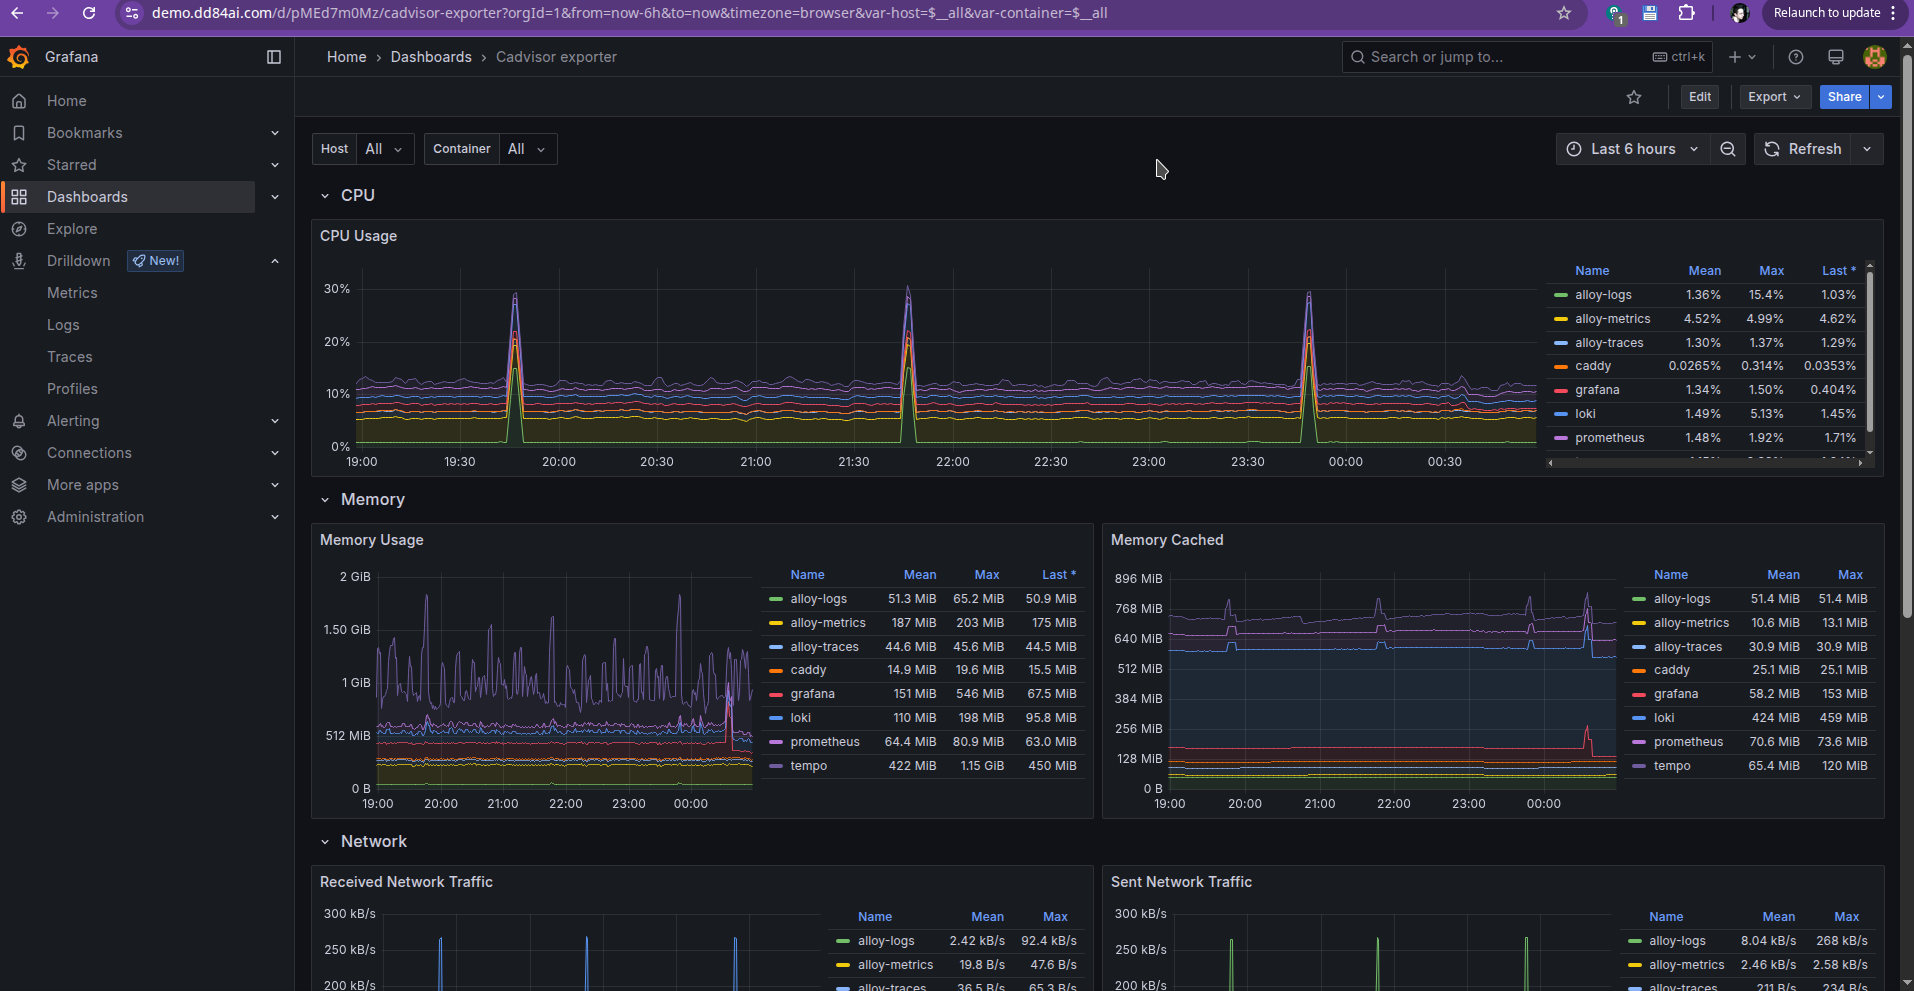
If you imported all right and your Grafana image version is 11.6 as supported by those dashboards and written in docker compose, you will see metrics about your containers and linux server accordingly
Cadvisor dashboard (about docker containers):
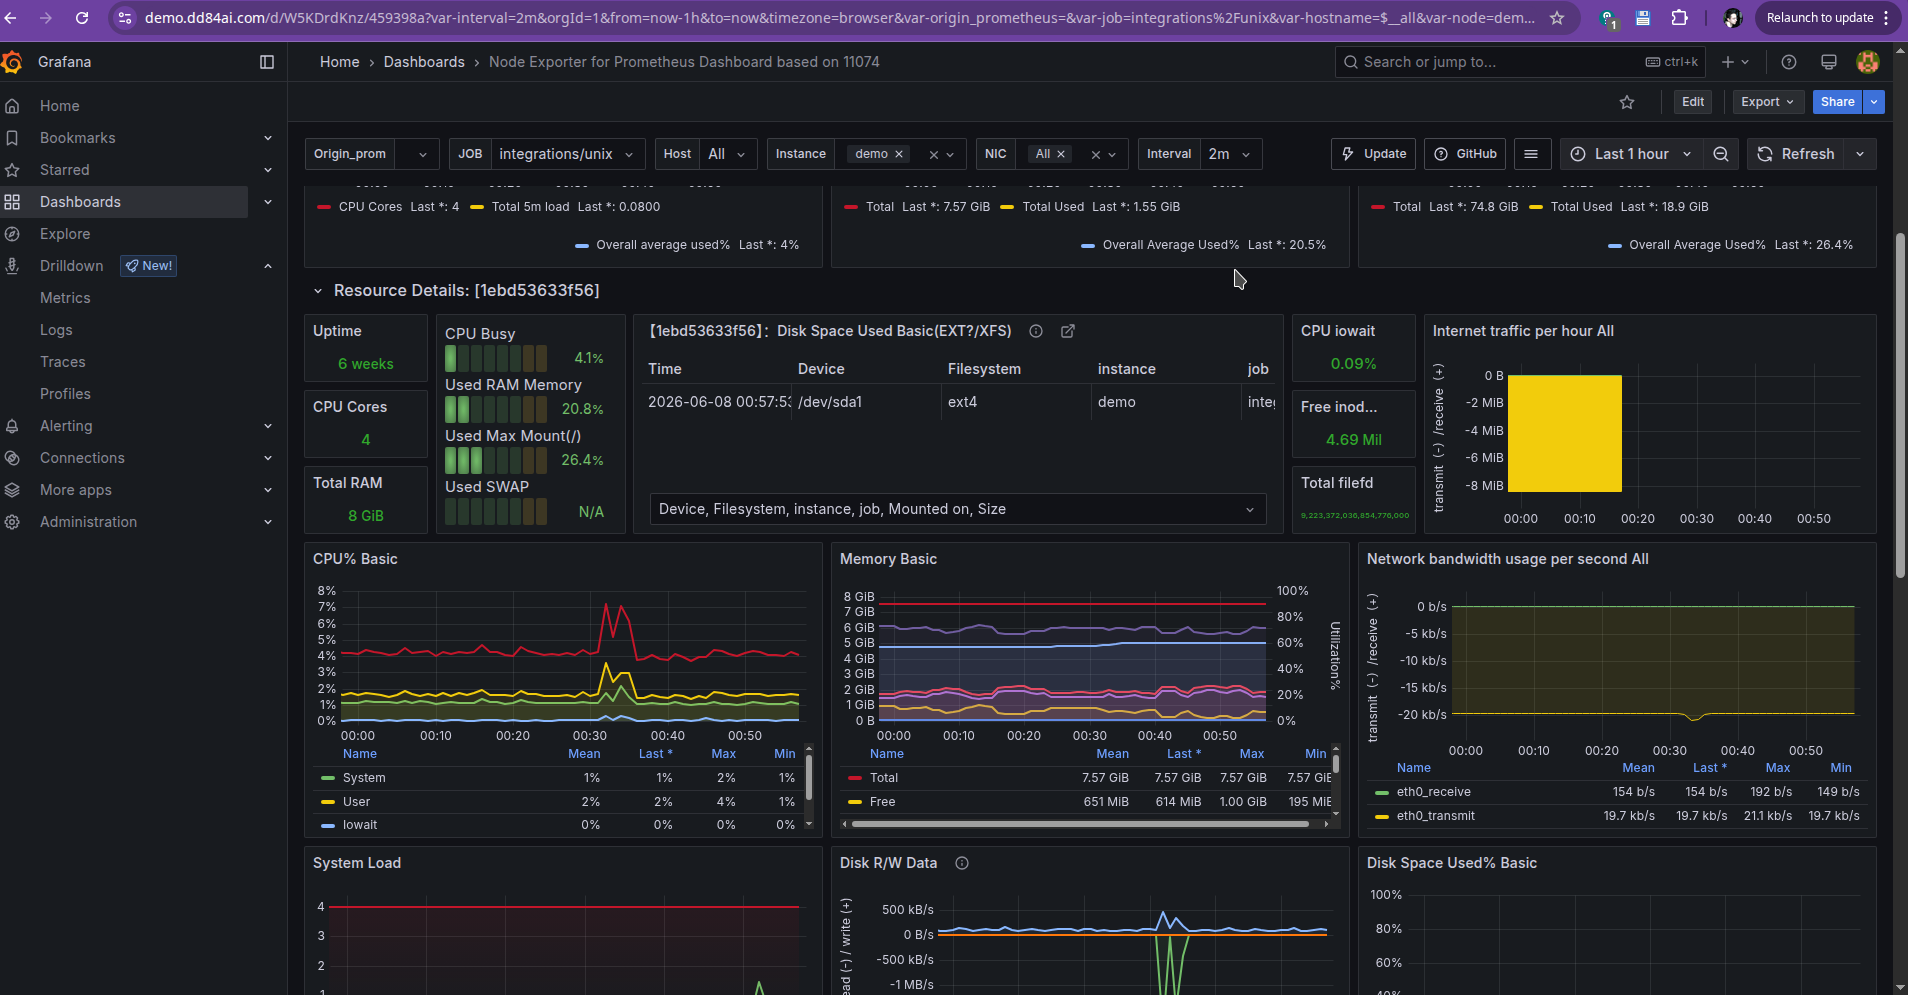
 Node exporter dashboard (about linux server):
Caution
if you remain not seeing dashboards properly, take note which grafana version you use. We can be sure it works fine with 11.6 at least
Note
grafana side of configurations author of article handles by terraform grafana provider instead of manual actions, with the next code used: https://github.com/darklab8/infra/tree/master/tf/grafana
if you what other kind of grafana dashboards, you could browse all choices people release there https://grafana.com/grafana/dashboards/ , of you can make your own.
Caution
if imported dashboards do not show data also in some of its graphs, make sure you have in data source of prometheus turned on timeInterval to 60s, the time of alloy scraping interval. If u raised grafana web interface with this article things, you will have it automatically as it is written in data source provisioning config
Now that we have the main infra dashboards handled, we need to try having some custom application metrics scraped and made into its own dashboard
Read throughly metric types existing there https://prometheus.io/docs/concepts/metric_types/ to understand how to write your own prometheus metrics. Roughly, we can say
I integrated my pet project with Go lib of Prometheus https://github.com/prometheus/client_golang added metrics and registered them in an explicit way for ability to add global labels https://github.com/darklab8/fl-darkstat/blob/master/darkcore/metrics/metrics.go
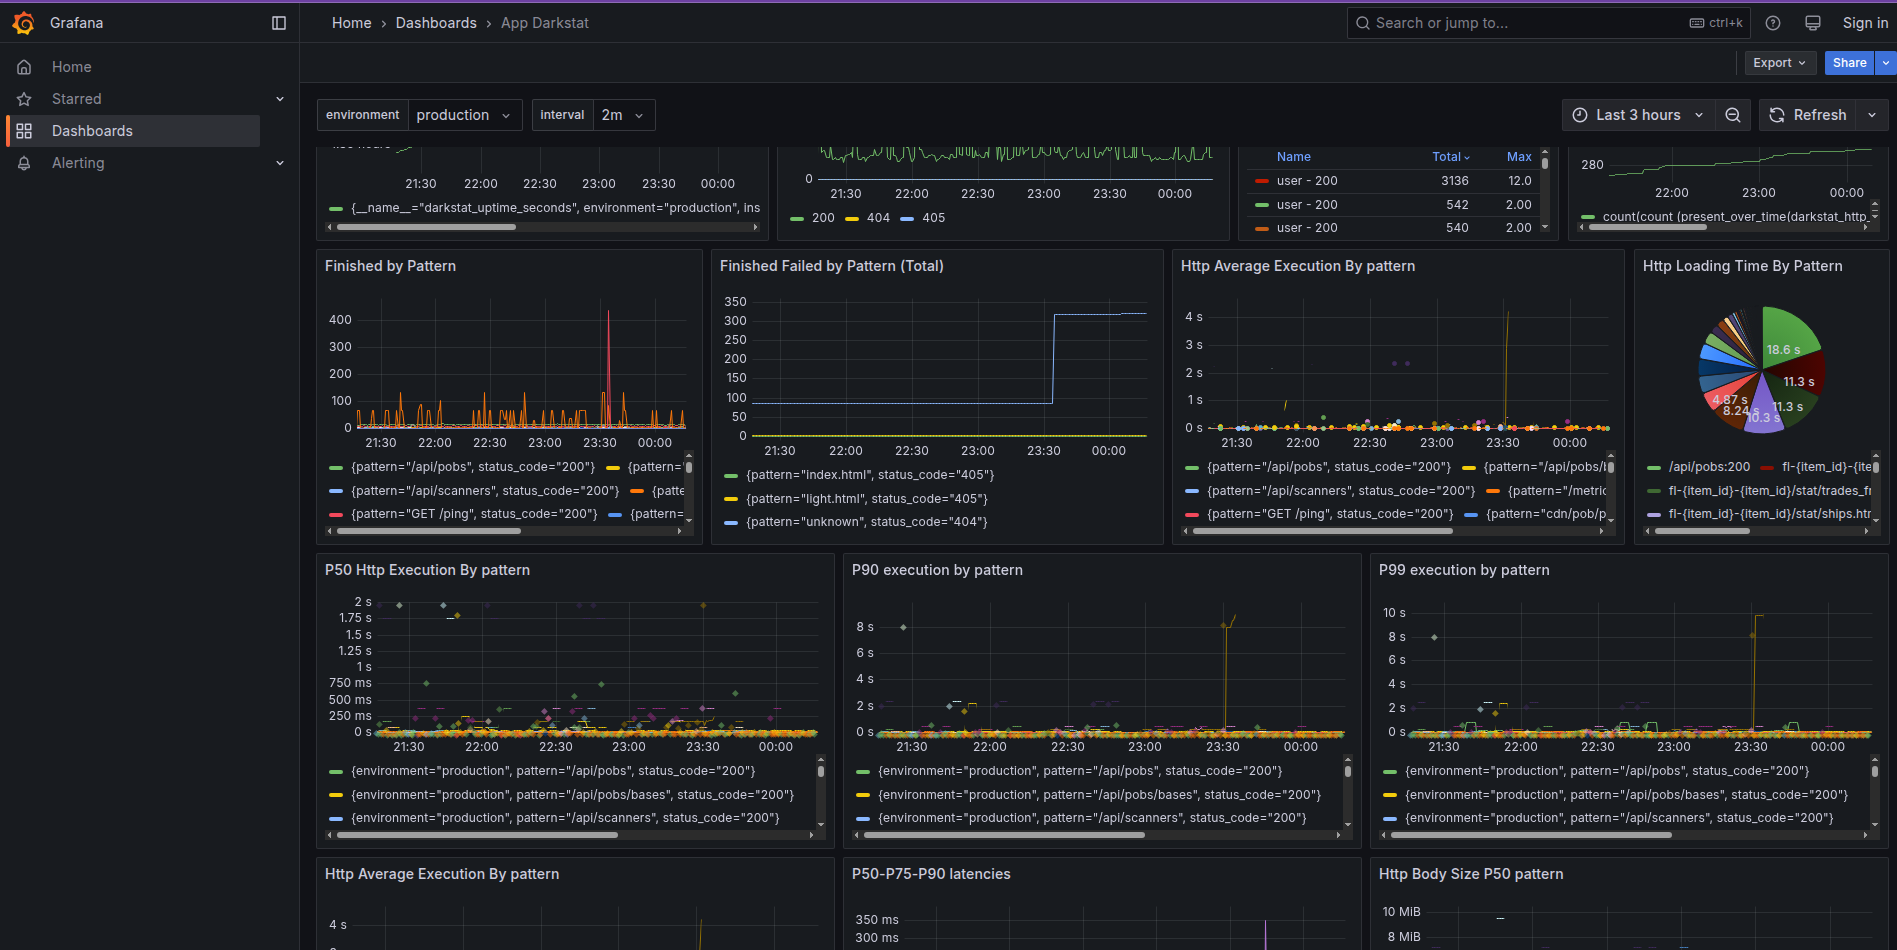
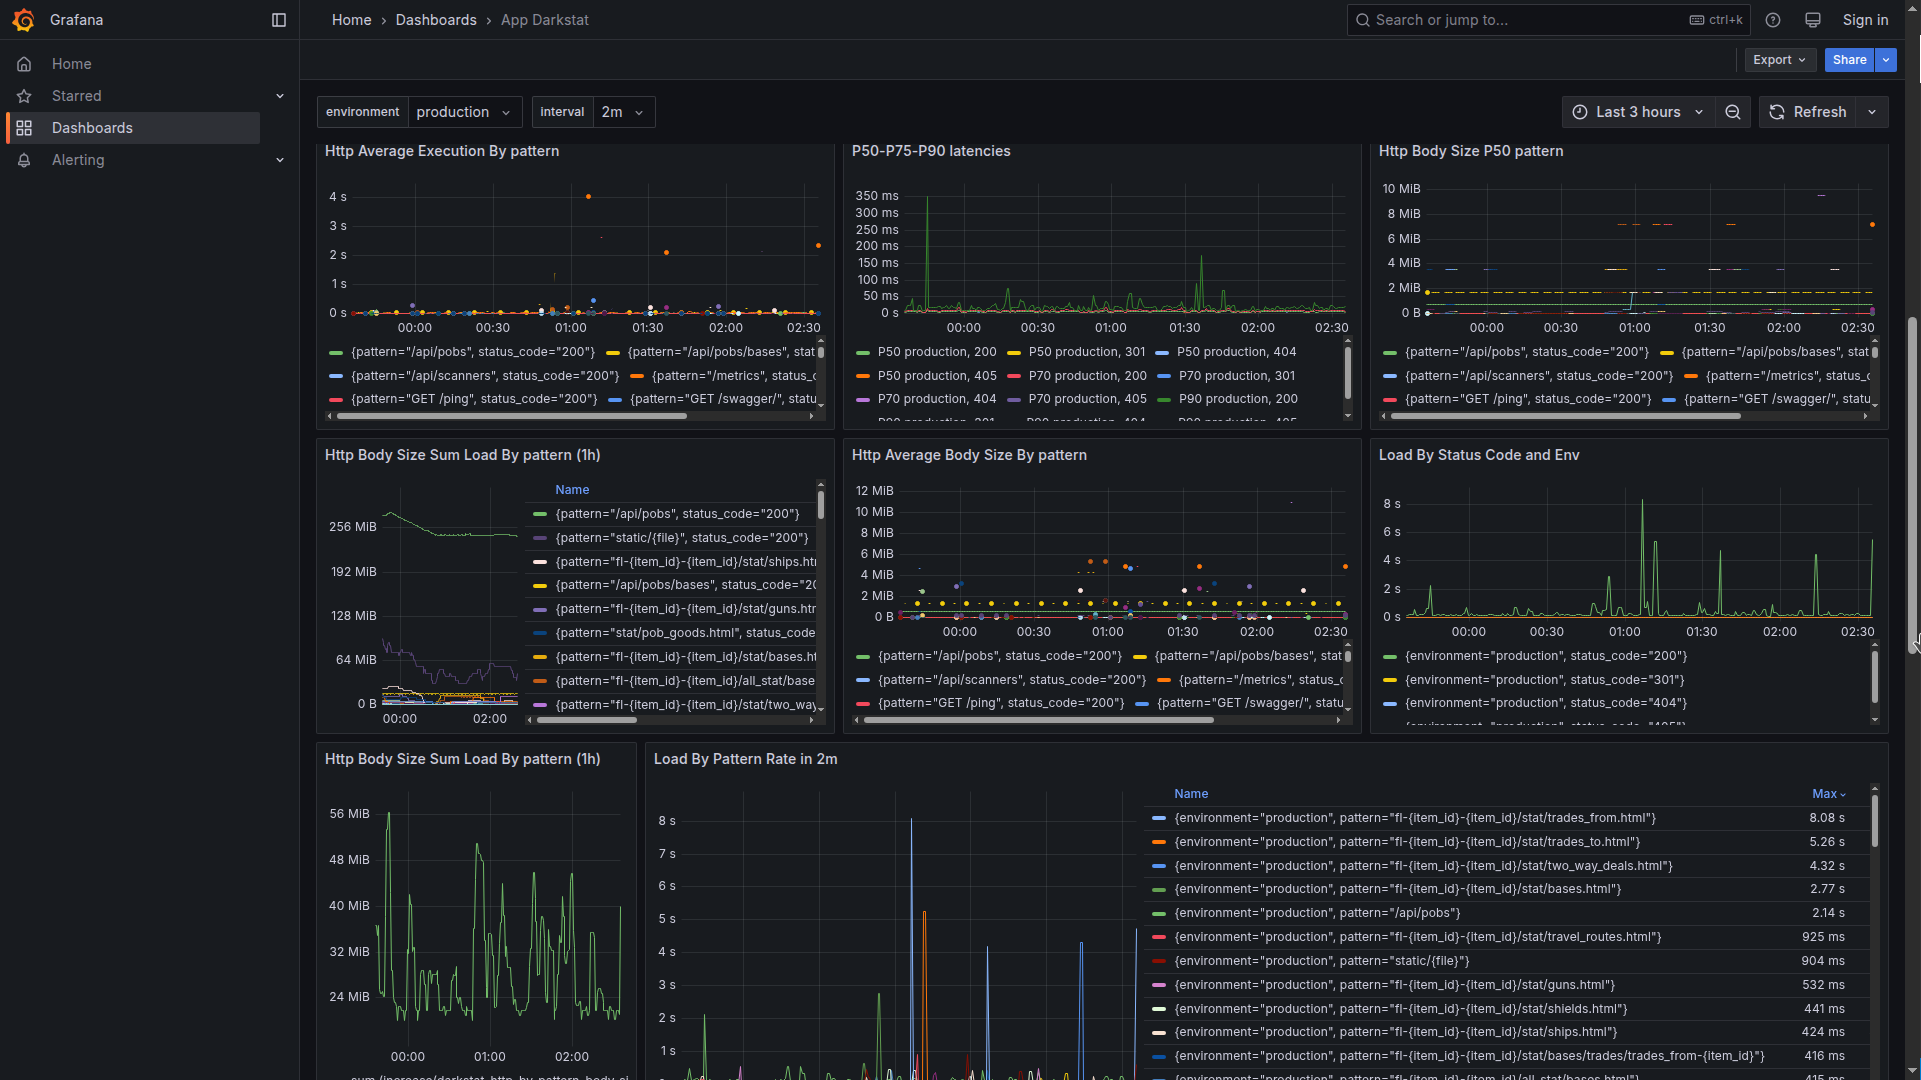
Based on that, I have for the project darkstat a detailed performance evaluating dashboard https://grafana.dd84ai.com/d/belbdnu2uqe4gd/app-darkstat?var-interval=2m&orgId=1&from=now-3h&to=now&timezone=browser&var-environment=production
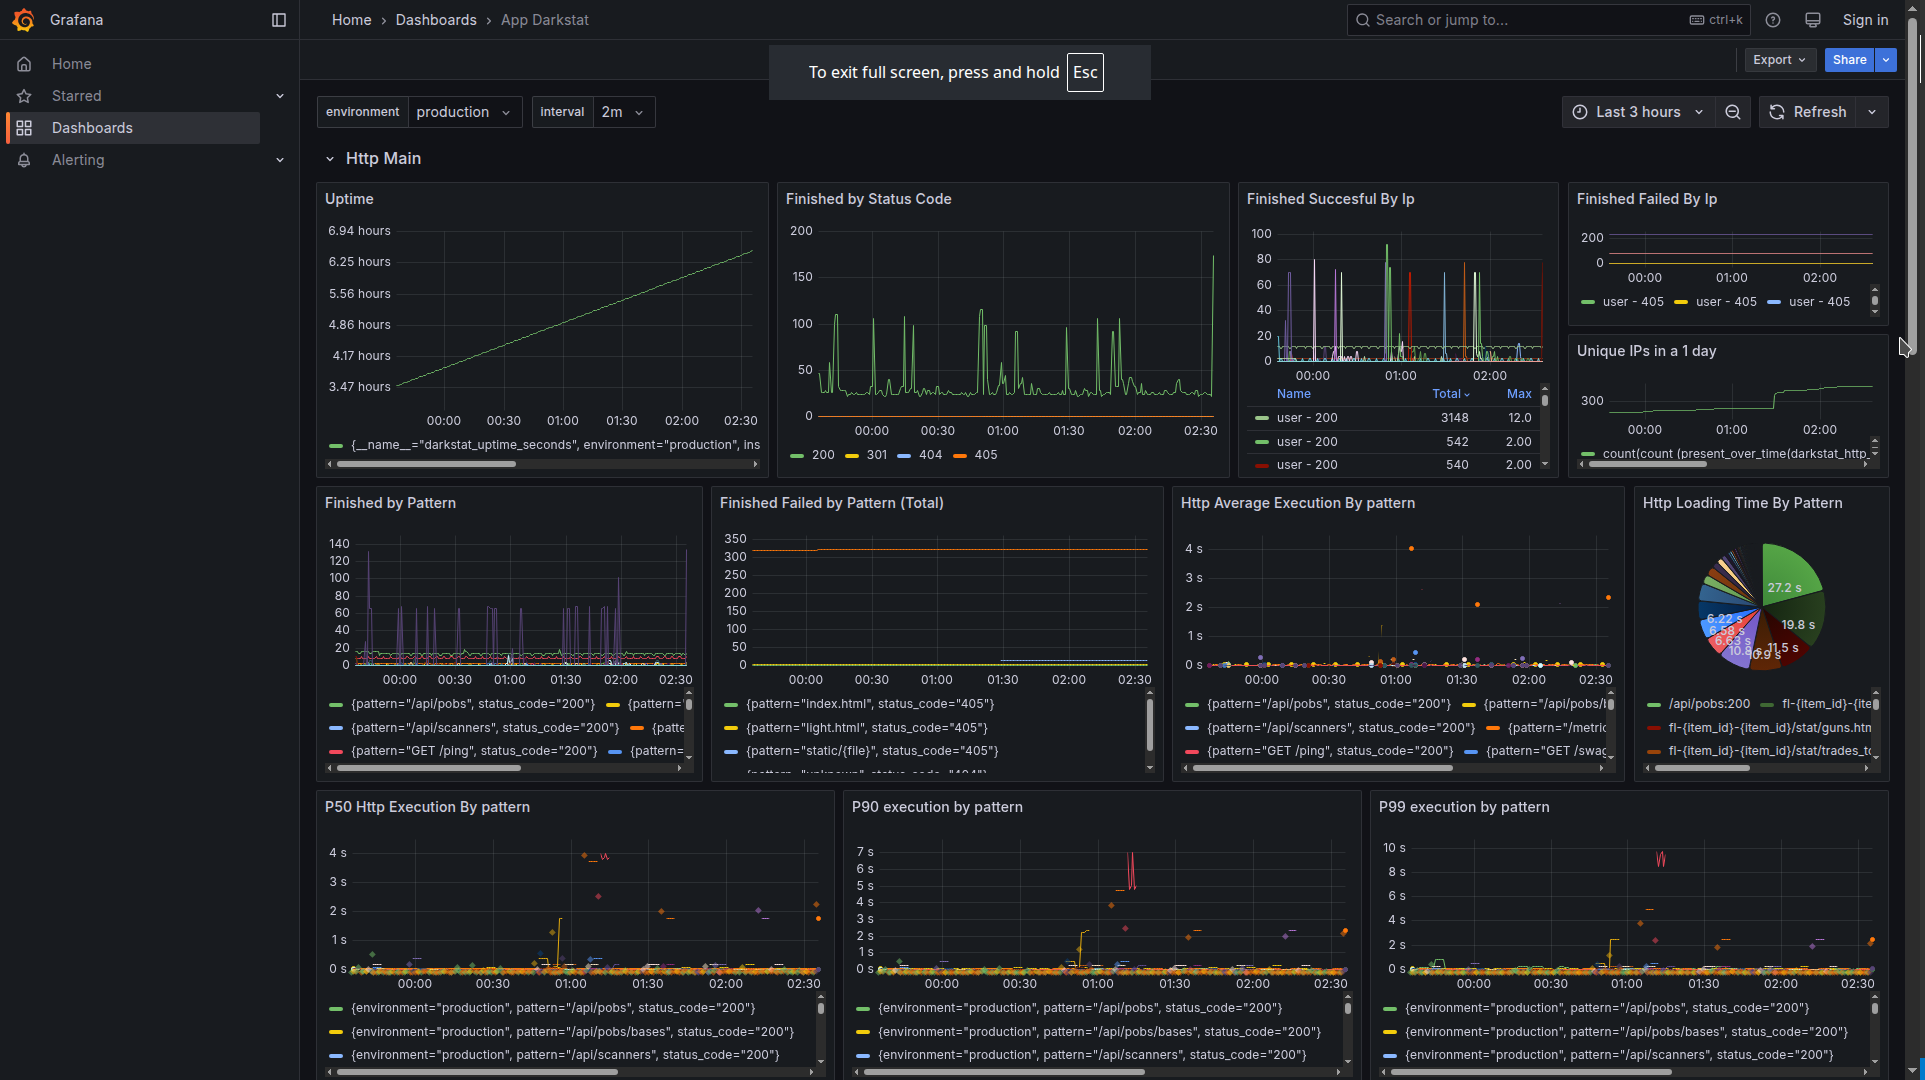
The code of this application dashboard is provided by link
What do we capture in application dashboards?
We capture with metrics what is most important for us to monitor:
The role of dashboard metrics is to tell us WHERE the issues are happening (but they do not have to tell exactly how they are happening, see traces/logs/profiles for more information). Plus metrics are also the most useful to be utilized in Alerts because of their performance efficiency :)
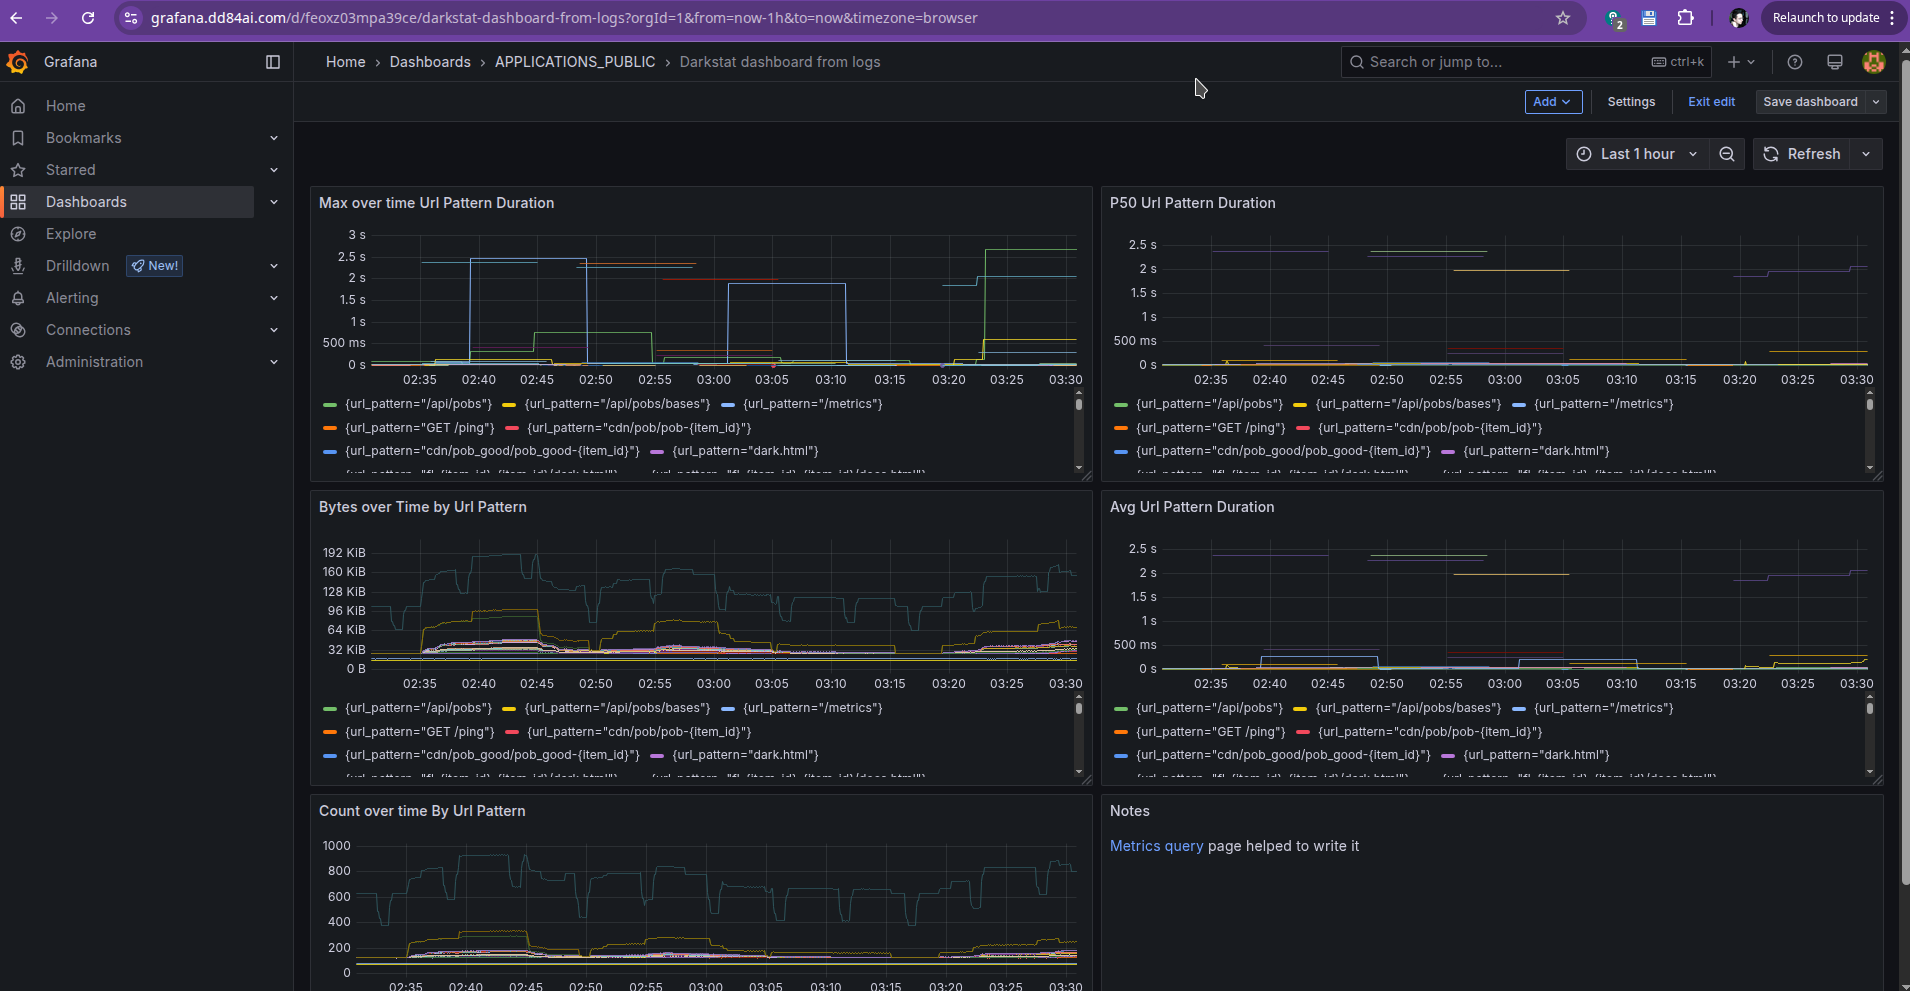
If we haven’t mentioned it before, we can make dashboards even from logs, but they will not be query performant and their usability is limited to applications with low logging volume. It is way easier to handle prometheus metrics that are emitted fews per minutes than applications with thousands of log lines per minute.
Example of dashboard based on logs can be found here and its code is here
Dashboard from logs:
As for dashboards based on traces? We can make generic dashboard that works based on metrics generated from traces. It is provided here and its code is here
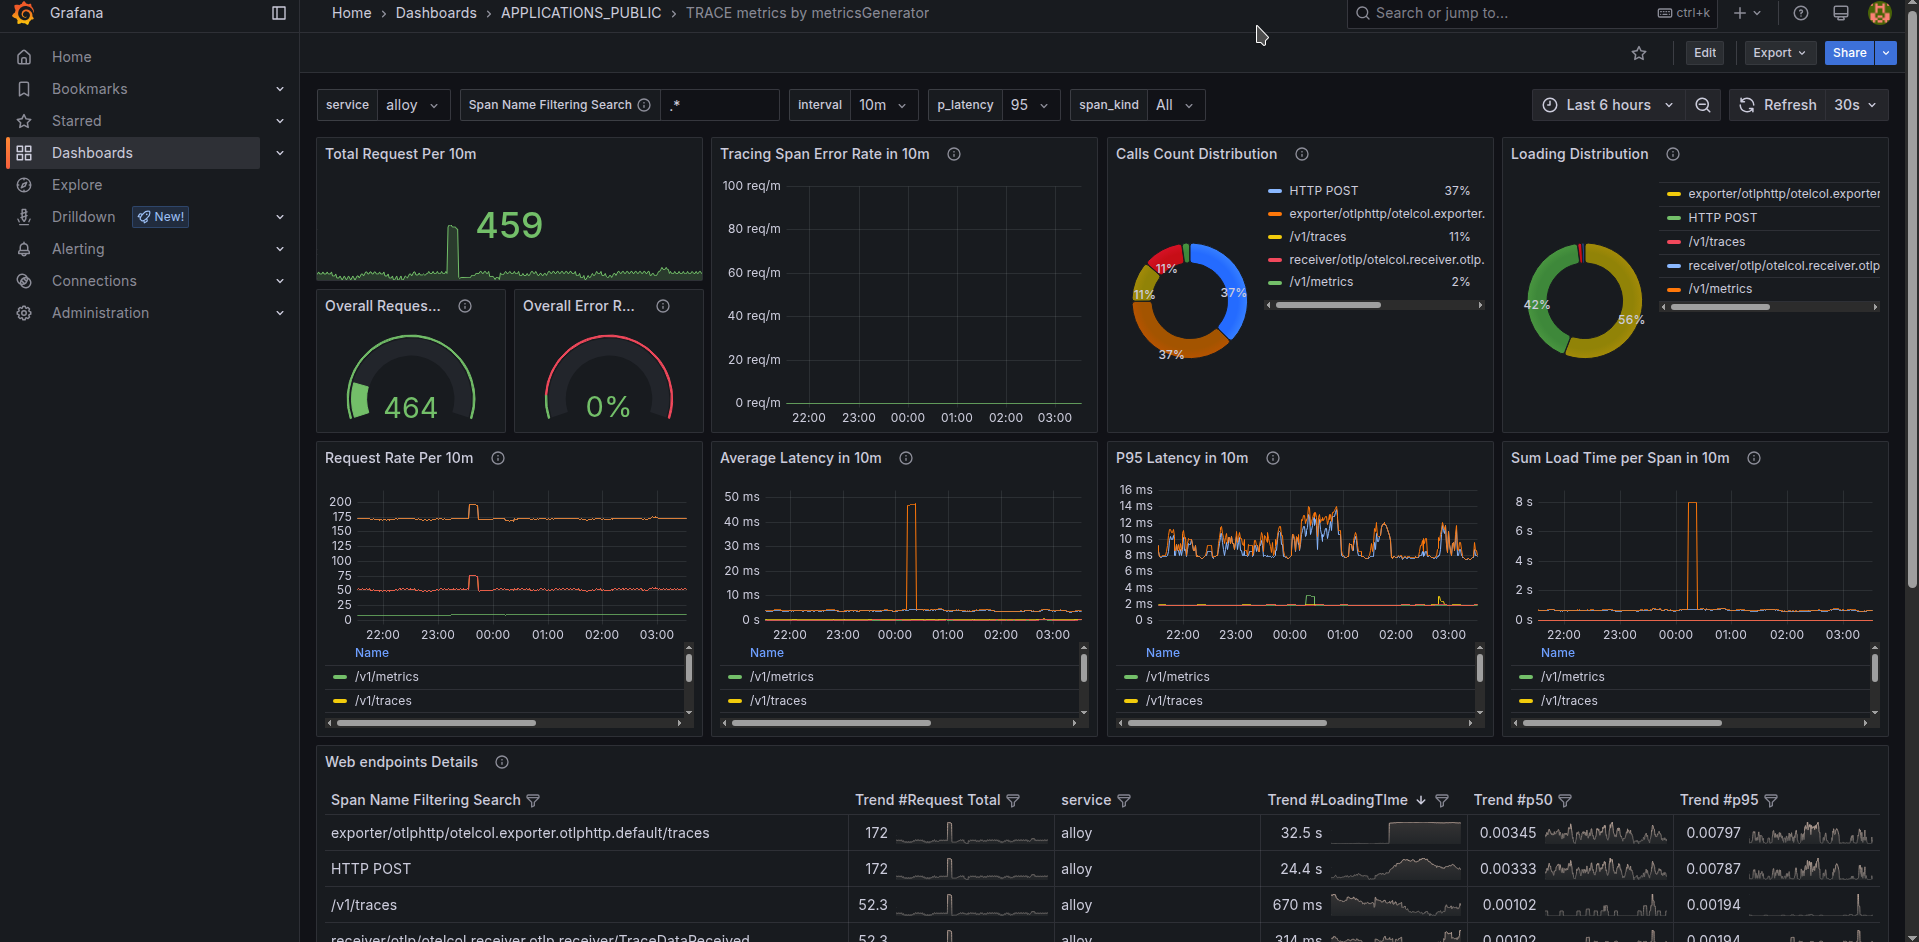
You may find it interesting because u get auto generated dashboard just because your app is connected to tracing. It has strong limitations of needing low cardinality used tracing span names though, if some application breaks this rule, it needs to be excluded from metrics generator usage.
Caution
turn off metrics generator is you are not needing trace apm dashboard, that will save you some used RAM
Additionally, dashboard graphs can be even generated from traceql metrics, which can be useful in tricky tracing searches. They aren’t again useful for average everyday usage because performance demand is too high there. Only Metrics based dashboards are performance efficient to be navigated plentifully.
All articles about monitoring configurations, including about prometheus metrics, are actively in use at least in homelab of the author through Terraform configuration. If you have any doubts, smth got outdated, less working and etc, see terraform code there as source of truth. With some chance article content will be updated in its repository and redeployed to github pages with fresh fixes. I can be reached for communications in issues to blog repo.
While prometheus is fine for a few hosts of homelab, or very small production: