
in a previous article we configured Grafana, Loki and Alloy for logs gathering.
in this article we are going through configuring Tracing with Tempo, and we assume that previous configurations of a system were already done from the Part 1 of the article series (like Grafana web gui configuration and Caddy web server at least). Our goal remains configuring Tracing for homelab and your pet projects. At the end of an article we mention production grade configuration tips
Tracing is your best friend in case you are monitoring backend systems, that have a lot of different networking requests to databases, third party apis, your own other services. Tracing show which exactly SQL query takes the most time to execute during them. Or it could show if your code is stuck in common N+1 problem of Django ORM (when you execute SQL query per each row instead of a single one due to forgotten select_related/fetch_related thing).
My best recommendation regarding integrating it in any language… approach problems with Middlewares/universal interceptors of network requests for every network interacting library you use. Make wrappers if necessary that automatically add tracing spans. Your code should be covered with tracing with least amount of effort automatically for all network interacting libs, then tracing is the most useful for backend apps!
Note
We have as some weak substistution for instrumentation in Go epbf based tool, but it is highly limited, your logs, metrics will not have connections to traces, and it works only for specific sub set of libraries which u can’t easily change. We will not be covering this tool usage in this series of article since it is not looking like good method to go by default.
Important
we provide docker-compose way of configuration as demo example because more devs are highly likely familiar and comfortable with docker-compose than with terraform. We utilize terraform for configuration of it and recommend it to use instead of docker-compose if u can. Book “Terraform up and running” is excellent place to start with it.
version: '3.8'

services:
  tempo:
    build:
      dockerfile: ./Dockerfile.tempo
      context: .
    container_name: tempo
    user: root
    entrypoint: ["sh", "-c"]
    command: ["/tempo -config.file=/etc/tempo.yaml"]
    networks:
      grafana:
        aliases:
          - tempo
    restart: always
    logging:
      driver: json-file
      options:
        mode: non-blocking
        max-buffer-size: 500m
    volumes:
      - tempo_data:/var/tempo
    mem_limit: 1000m

  alloy-traces:
    build:
      dockerfile: ./Dockerfile.alloy.traces
      context: .
    container_name: alloy-traces
    entrypoint: ["/bin/alloy"]
    command: ["run","/etc/alloy/config.alloy","--storage.path=/var/lib/alloy/data"]
    restart: always
    logging:
      driver: json-file
      options:
        mode: non-blocking
        max-buffer-size: 500m
    volumes:
      - /var/run/docker.sock:/var/run/docker.sock:ro
    networks:
      grafana:
        aliases:
          - alloy-traces
    mem_limit: 1000m

volumes:
  tempo_data:
    name: "tempo_data"

networks:
  grafana:
    name: grafana
    external: true
Participating configs:
Proceed to apply deployment for raising the tracing stack part (or use Opentofu(Terraform) to raise all stuff together as modules from ./main.tf)
git clone --recurse-submodules https://github.com/darklab8/blog
cd blog/articles/article_detailed/article_20250609_grafana/code_examples

export DOCKER_HOST=ssh://root@homelab
docker ps

# ONLY if you did not do things from first article part about Loki and follow docker-compose path:
docker compose up -d caddy # we need it for reverse proxy and automated TLS certs
docker compose up -d grafana # visualizer where we query traces. Already yaml of provisioned datasources and installed plugin for tracing drilldown interface

# Continue with Tracing article content:
# if docker-compose way:
docker compose -f docker-compose.tracing.yaml build
docker compose -f docker-compose.tracing.yaml up -d tempo # tracing backend
docker compose -f docker-compose.tracing.yaml up -d alloy-traces # agent collector of traces to which we can send them over network

# if opentofu way
tofu init
tofu apply

# after deploy, u need to grant tempo proper rights to be persistent and possible to init
chmod -R a+rw /var/lib/docker/volumes/tempo_data
chmod -R a+rw /var/lib/docker/volumes/grafana_data # just in case grant grafana rights too if not granted
export DOCKER_HOST=ssh://root@homelab
docker compose -f docker-compose.app-traces.yaml build
docker compose -f docker-compose.app-traces.yaml run -it app-traces-go
with the next code is deployed
package main

import (
	"context"
	"errors"
	"fmt"
	"math/rand/v2"
	"time"

	"github.com/darklab8/go-typelog/otlp"
	"github.com/darklab8/go-utils/typelog"
	"go.opentelemetry.io/otel"
)

type WebEndpoint struct {
	pattern      string
	max_duration float64
	url          func() string
}

var WebEndpoints = []WebEndpoint{
	{
		pattern:      "/index.html",
		max_duration: 0.1,
		url:          func() string { return "/index.html" },
	},
	{
		pattern:      "/some_pattern1",
		max_duration: 1,
		url:          func() string { return "/some_pattern1" },
	},
	{
		pattern:      "/another_pattern",
		max_duration: 2,
		url:          func() string { return "/another_pattern" },
	},
	{
		pattern:      "/books/__book_id__",
		max_duration: 0.1,
		url:          func() string { return fmt.Sprintf("books/%d", rand.IntN(100)) },
	},
	{
		pattern:      "/books/__book_id__/page/__page_id__",
		max_duration: 0.2,
		url:          func() string { return fmt.Sprintf("books/%d/page/%d", rand.IntN(100), rand.IntN(1000)) },
	},
}

var (
	logger *typelog.Logger = typelog.NewLogger("go-demo-app")
	Tracer                 = otel.Tracer("go-demo-app")
)

func NestedAction(ctx_span context.Context) {
	ctx_span, span := Tracer.Start(ctx_span, "nested action")
	defer span.End()
}

func doRun() {
	time_start := time.Now()
	fmt.Println("started run", time_start)
	ctx_span, span := Tracer.Start(context.Background(), "web request")
	defer span.End()

	time.Sleep(3 * time.Second)

	web_endpoint := WebEndpoints[rand.IntN(len(WebEndpoints))]
	duration := rand.Float64() * web_endpoint.max_duration
	pattern := web_endpoint.pattern
	logger.InfoCtx(ctx_span, "web request",
		typelog.String("url_pattern", pattern),
		typelog.Float64("duration", duration),
		typelog.String("url_path", web_endpoint.url()),
	)
	NestedAction(ctx_span)
	fmt.Println("fninished run", time.Now(), time.Since(time_start))
	time.Sleep(3 * time.Second)
}

func main() {
	fmt.Println("starting app-traces")
	ctx := context.Background()
	otelShutdown, err := otlp.SetupOTelSDK(ctx) // Set up OpenTelemetry.
	if err != nil {
		fmt.Println("error to initialize tracing, err=", err.Error())
	}
	defer func() { // Handle shutdown properly so nothing leaks.
		err = errors.Join(err, otelShutdown(context.Background()))
	}()
	fmt.Println("configured tracing")
	for {
		doRun()
		time.Sleep(30 * time.Second)
	}
}
and we see in its logging its working
> starting app-traces
> configured trading
> started run 2026-04-27 01:33:20.263967654 +0000 UTC m=+0.004603667
> fninished run 2026-04-27 01:33:23.264569558 +0000 UTC m=+3.005205571 3.000601995s
If everything is all right and no errors appears at any level in the chain of
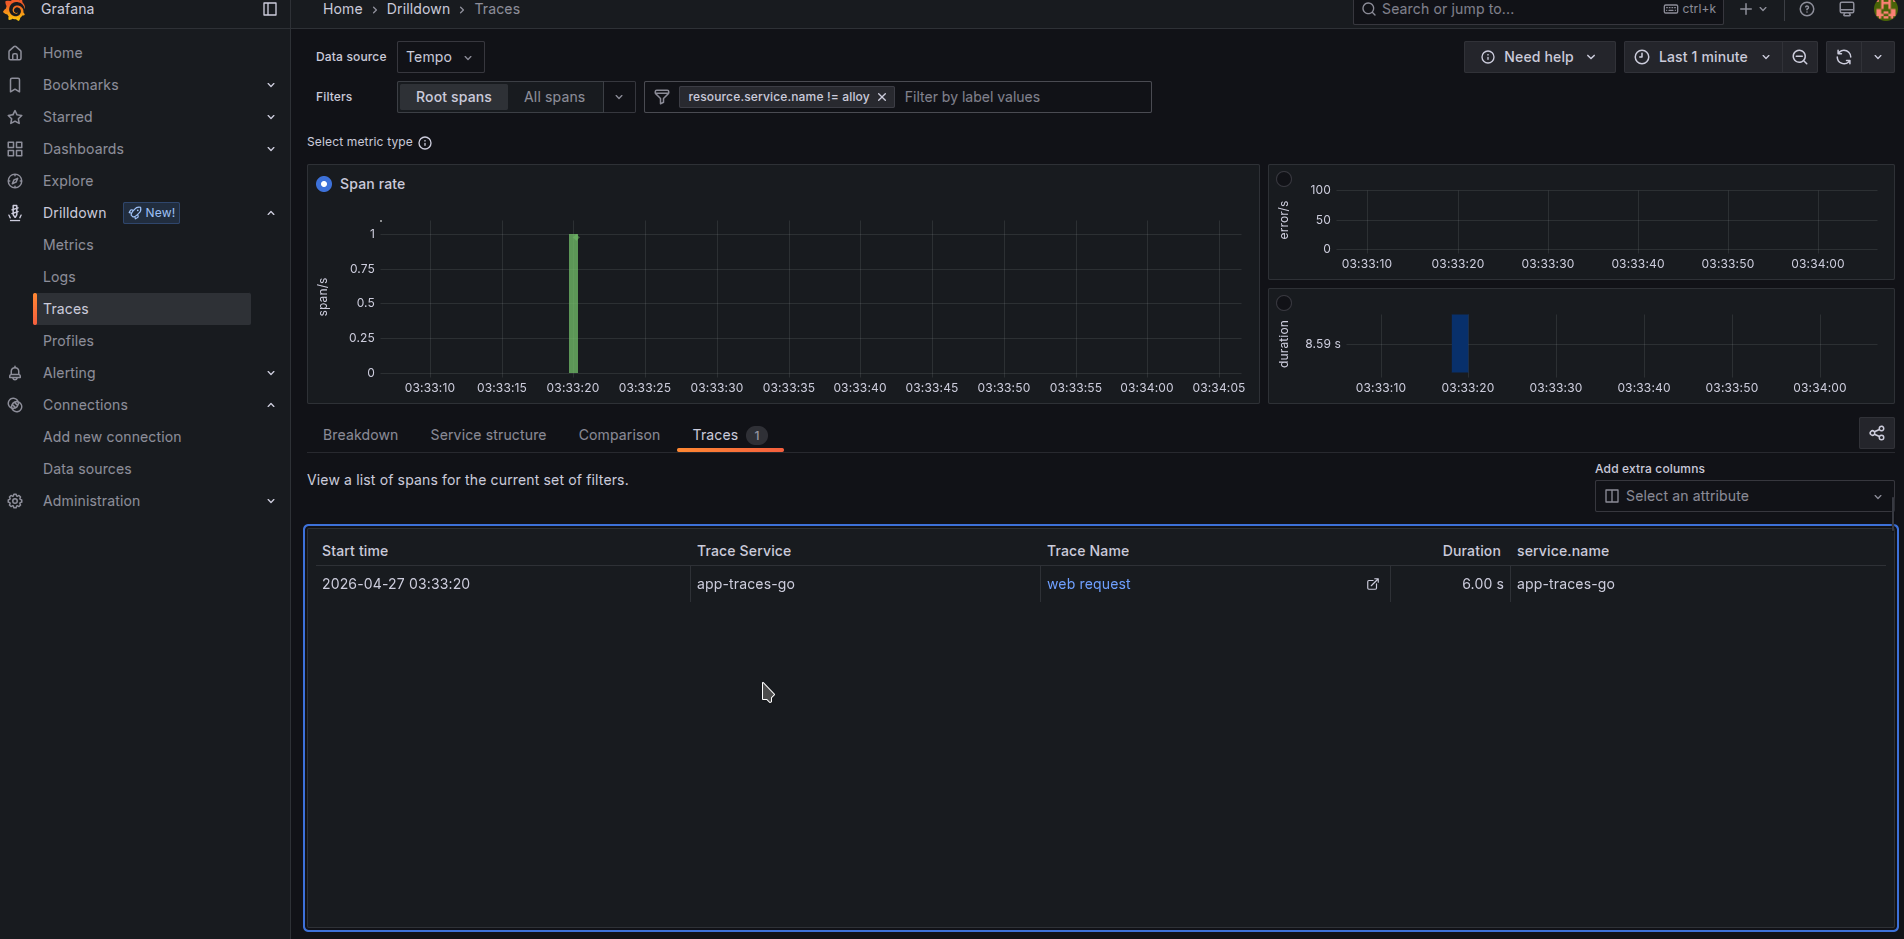
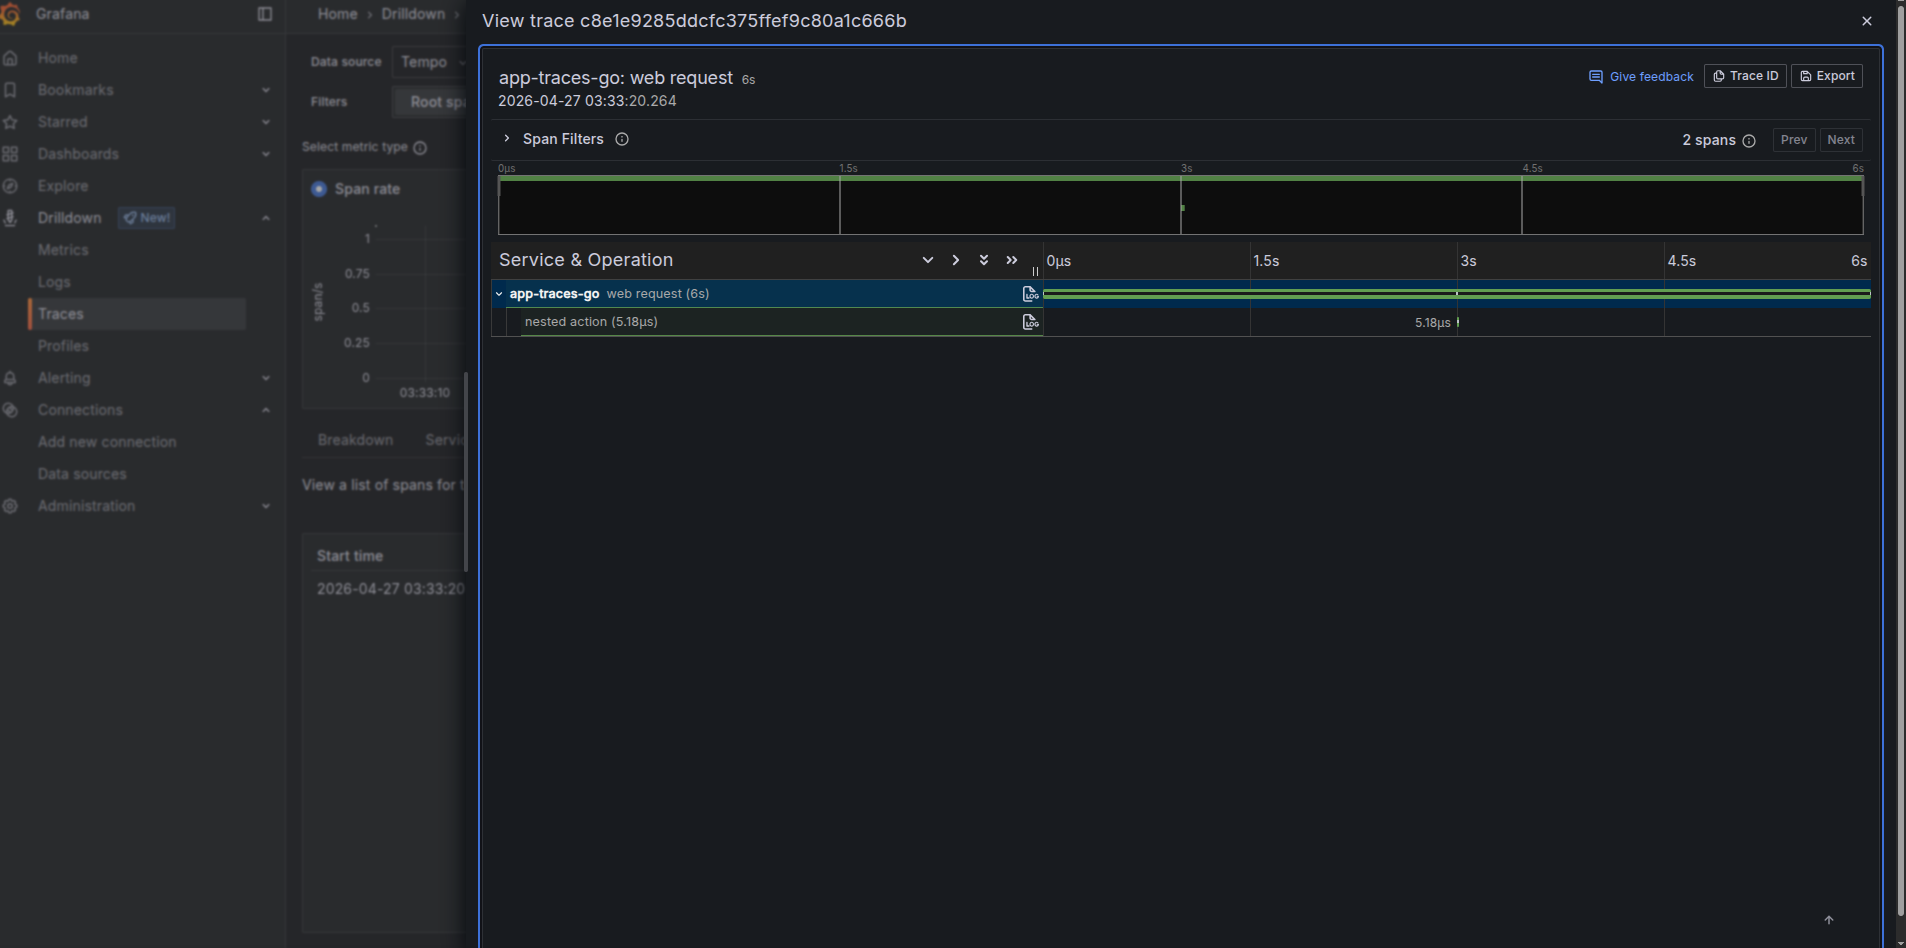
docker logs app-traces-go)docker logs alloy-traces)docker logs tempo) and has no errors related to issues like unable to init backend because not having sufficient rights to initialize its data folder (to fix which u need to run chmod -R a+rw /var/lib/docker/volumes/tempo_data/)docker logs grafana)You will see traces visible in your tracing drilldown interface then!
In a real world tracing is the most useful for backend applications and the best to turn it on by default for all the network interacting libraries through writing some kind of middleware.
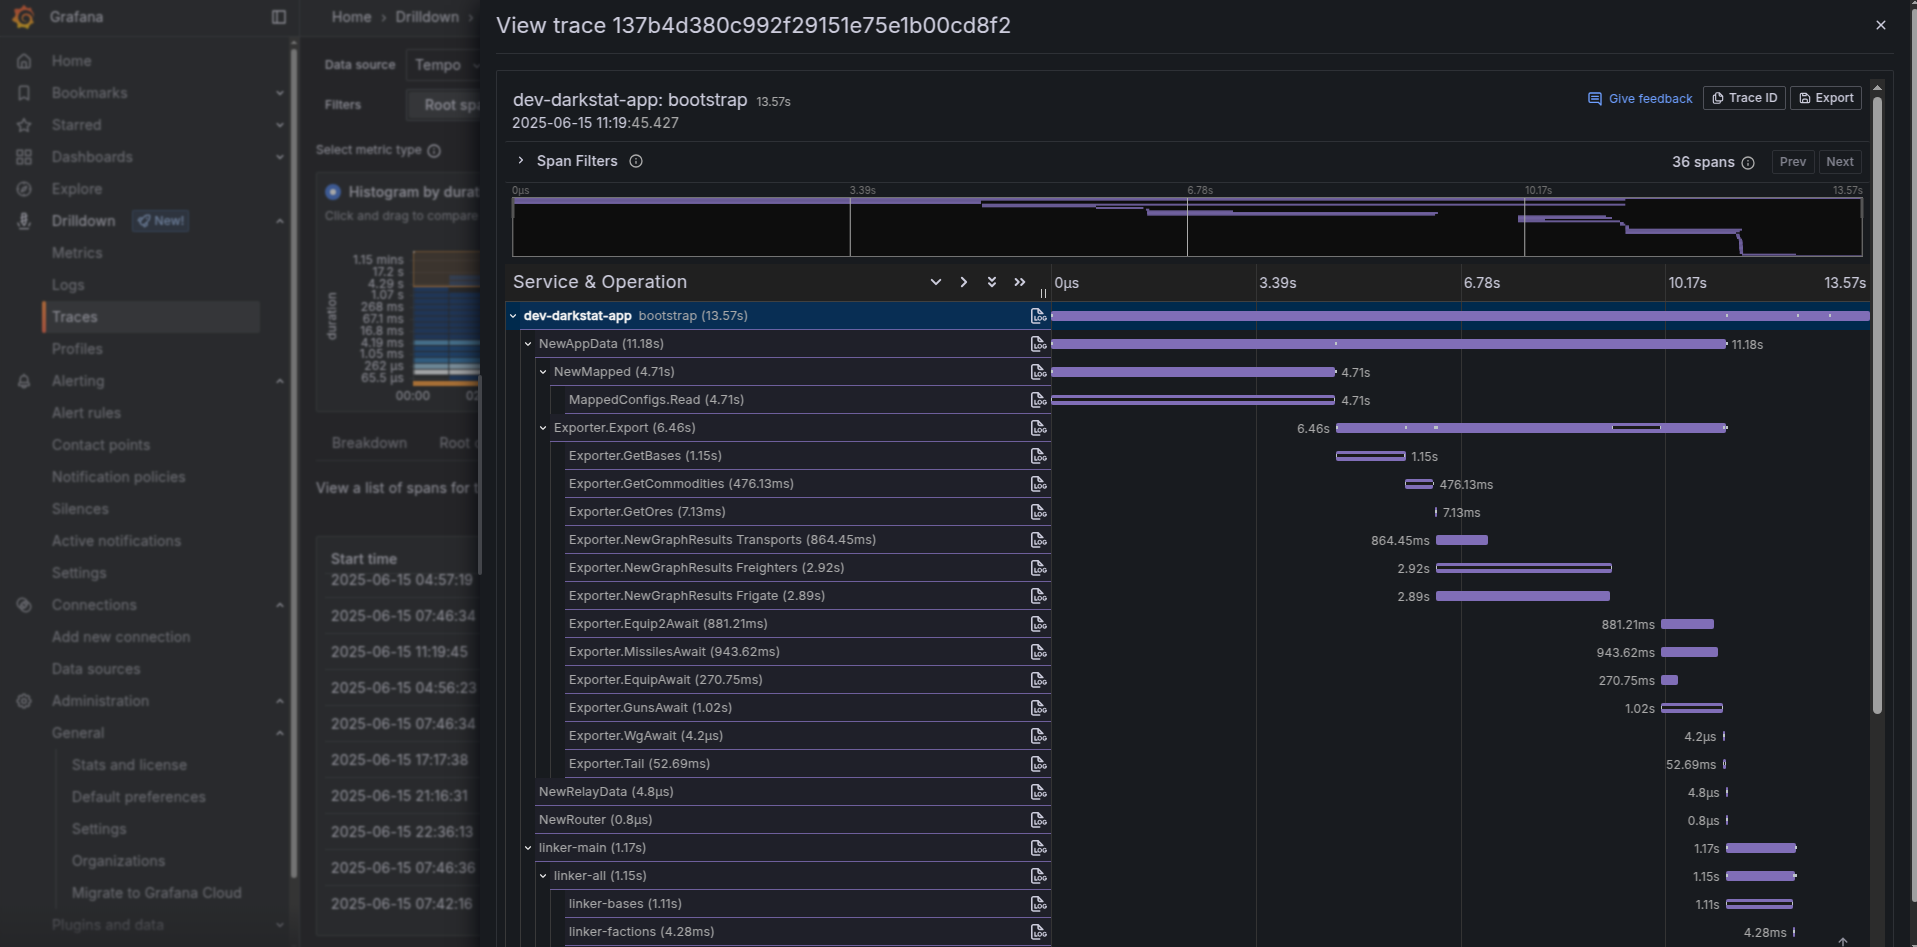
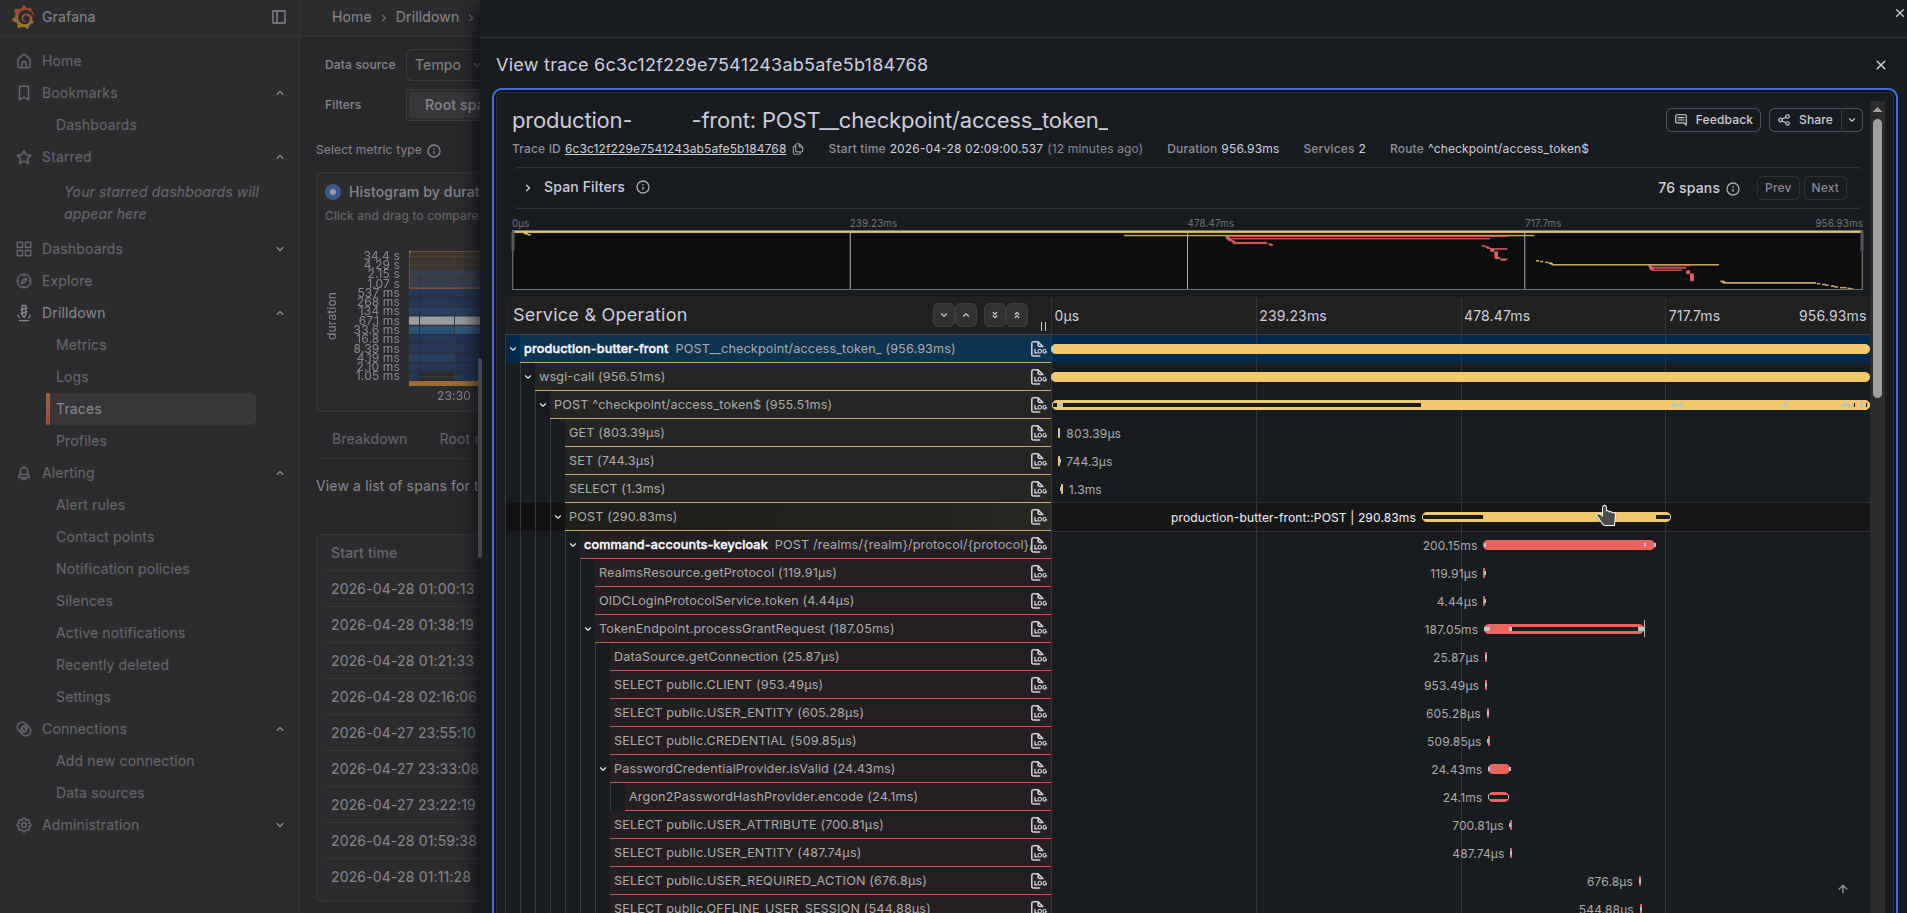
Then it will be able to answer you that issues you have at specific SQL request, or elastic search query, or specific http request. And since it is distributed tracing, the trace will shown how workload works within the called service too (as you can see on the picture below we have https request propagated into Keycloak to show internals of its authorization inside of it)!
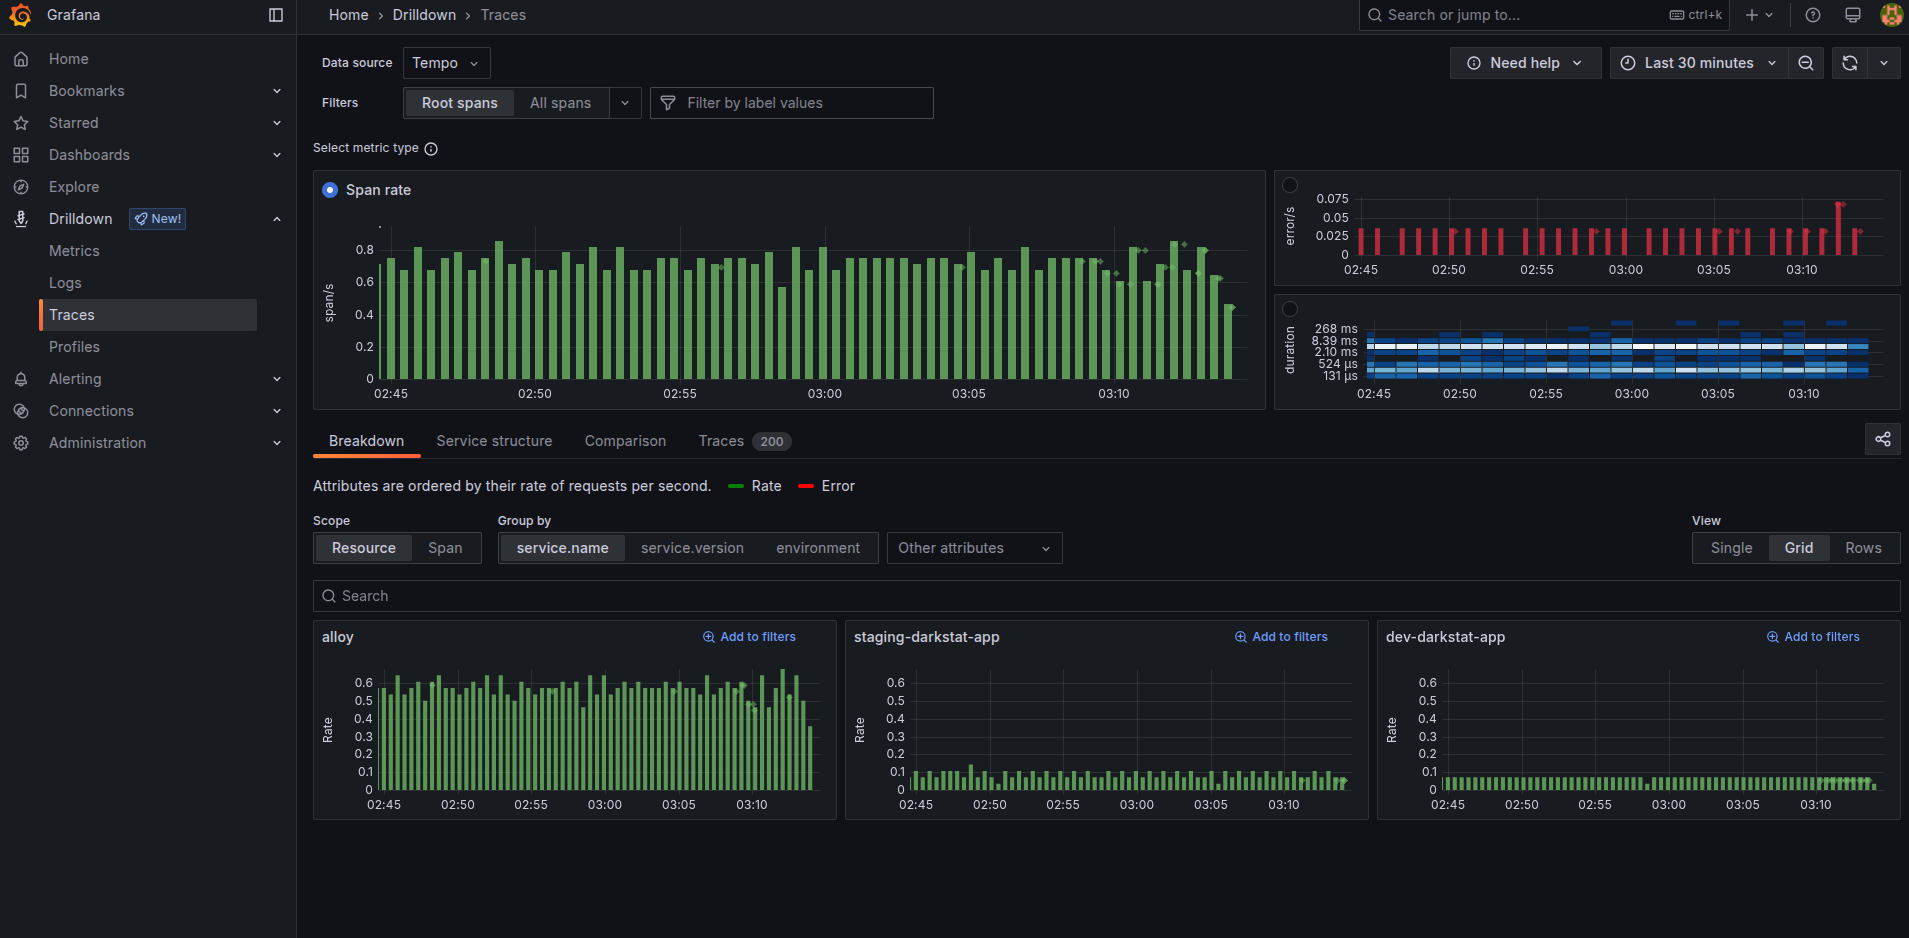
Tracing drilldown interface simplifies navigating over them. Clicking blue graph by duration, you can easily find slowest ones. Click errors to find errors. input different filters from “service_name” to kubernetes cluster names and namespaces to filter traces by different places.
Note
In pet projects Tracing usability is honestly very limited, since it is very doubtful for pet project to have any kind of network interaction long enough requiring tracing debugging. Just because your database will rarely reach the level requiring to debug it. You will benefit in pet projects more from Logging and Metrics monitoring system. At any backend real work though, tracing is the most useful system to have, i would dare to say potentially even more useful than any other type of monitoring.
grafana plugin was fixed to specific version for the article to continue working in 2026 year
This choice makes things compatible with article part 3 about dashboards that depend on the same grafana version.